
Python-碰到matplotlib 打数据标签的一个问题,没有解出来,请各位若能在工作、学习之余 可以有空的话帮忙看看?
最近碰到matplotlib 打数据标签的一个问题,没有解出来,请各位若能在工作、学习之余 可以有空的话帮忙看看具体该怎么解决:
(经过百度多次查询,未能解决,希望在这里可以得到帮助)
预期:想在轴上打数据标签,但没有打动。
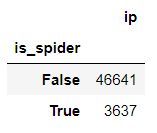
'柱形图 bar 'x = df_spider1.index.tolist()
y = df_spider1.values.flatten()
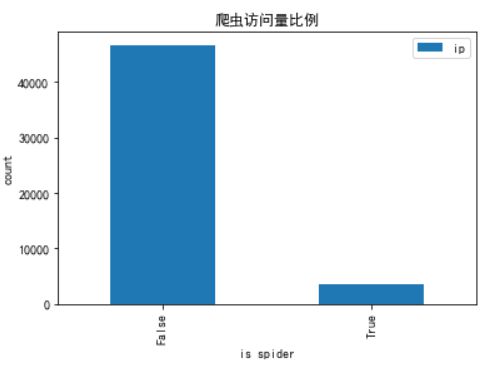
df_spider1.sort_index().plot(kind = 'bar')
plt.xlabel('is spider')
plt.ylabel('count')
plt.title('爬虫访问量比例')
# 数字标签
for a,b in zip(x,y):
plt.text(x,y,
'%.0f' % y,
fontsize=15,
verticalalignment="top",
horizontalalignment="right"
)
plt.show()
TypeError Traceback (most recent call last)
<ipython-input-109-c31ea76477c9> in <module>
19 for a,b in zip(x,y):
20 plt.text(x,y,
---> 21'%.0f'% y,
22 fontsize=15,
23 verticalalignment="top",
TypeError: only size-1 arrays can be converted to Python scalars
以上是 Python-碰到matplotlib 打数据标签的一个问题,没有解出来,请各位若能在工作、学习之余 可以有空的话帮忙看看? 的全部内容, 来源链接: utcz.com/p/937866.html


