vue3.0+echarts实现立体柱图
前言:
vue3.0实现echarts立体柱图
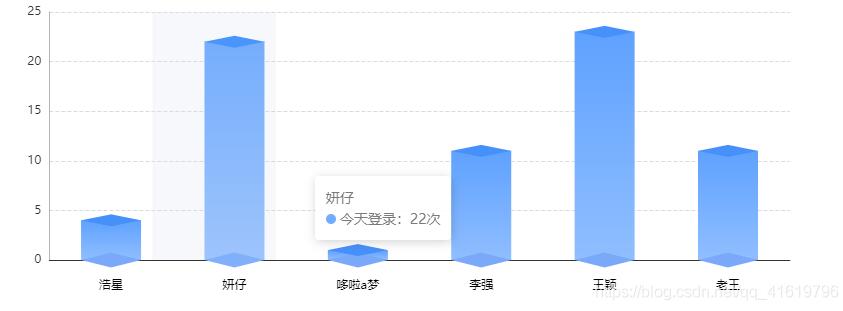
实现效果:
实现步骤:
1、安装echarts
cnpm i --save echarts
2、页面定义容器
<template>
<div ref="echart" class="echartDiv"></div>
</template>
3、js中引入echarts
import * as echarts from 'echarts';
组件完整源码:
<template>
<div ref="echart" class="echartDiv"></div>
</template>
<script>
import * as echarts from 'echarts';
import { onMounted,toRefs, ref,reactive } from 'vue';
export default {
setup(){
let state = reactive({
xAxisData:['浩星','妍仔','哆啦a梦','李强','王颖','老王'],
yAxisData:[4,22,1,11,23,11],
yAxisData1:[1,1,1,1,1,1],
echart: ref(),
})
const echartInit = () =>{
var myChart = echarts.init(state.echart);
// 指定图表的配置项和数据
var option = {
tooltip: {
trigger: "axis",
axisPointer: {
type: "shadow", // 默认为直线,可选为:'line' | 'shadow'
},
formatter: function(parms) {
var str =
parms[0].axisValue +
"</br>" +
parms[0].marker +
"今天登录:" +
parms[0].value + '次'
return str;
},
},
textStyle: {
color: "#333",
},
color: ["#7BA9FA", "#4690FA"],
grid: {
containLabel: true,
left: "10%",
top: "20%",
bottom: "10%",
right: "10%",
},
xAxis: {
type: "category",
data: state.xAxisData,
axisLine: {
lineStyle: {
color: "#333",
},
},
axisTick: {
show: false,
},
axisLabel: {
margin: 20, //刻度标签与轴线之间的距离。
textStyle: {
color: "#000",
},
},
},
yAxis: {
type: "value",
axisLine: {
show: true,
lineStyle: {
color: "#B5B5B5",
},
},
splitLine: {
lineStyle: {
// 使用深浅的间隔色
color: ["#B5B5B5"],
type: "dashed",
opacity: 0.5,
},
},
axisLabel: {},
},
series: [{
data: state.yAxisData,
stack: "zs",
type: "bar",
barMaxWidth: "auto",
barWidth: 60,
itemStyle: {
color: {
x: 0,
y: 0,
x2: 0,
y2: 1,
type: "linear",
global: false,
colorStops: [{
offset: 0,
color: "#5EA1FF",
},
{
offset: 1,
color: "#90BEFF",
},
],
},
},
},
//下面的立体,控制颜色是color第一个
{
data: state.yAxisData1,
type: "pictorialBar",
barMaxWidth: "20",
symbol: "diamond",
symbolOffset: [0, "50%"],
symbolSize: [60, 15],
zlevel: 2,
},
//上面的立体,控制颜色是color第二个
{
data: state.yAxisData,
type: "pictorialBar",
barMaxWidth: "20",
symbolPosition: "end",
symbol: "diamond",
symbolOffset: [0, "-50%"],
symbolSize: [60, 12],
zlevel: 2,
}
],
};
// 使用刚指定的配置项和数据显示图表。
myChart.setOption(option);
}
//挂载
onMounted(()=>{
echartInit()
})
return {
...toRefs(state),
echartInit
};
}
}
</script>
<style lang='scss' scoped>
.echartDiv{
width: 100%;
height: 400px;
}
</style>
以上就是本文的全部内容,希望对大家的学习有所帮助,也希望大家多多支持。
以上是 vue3.0+echarts实现立体柱图 的全部内容, 来源链接: utcz.com/p/239648.html