vue+echarts实现进度条式柱状图
本文实例为大家分享了vue+echarts实现进度条式柱状图的具体代码,供大家参考,具体内容如下
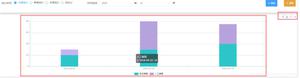
效果图如下

代码:
<template>
<div class="content-page">
<div class="tab-content">
<div id="myChart1"></div>
</div>
</div>
</template>
<script>
import * as echarts from 'echarts';
export default {
data() {
return {
option: {
color: ["#157ef5"],// 设置柱状图的颜色
textStyle: {
color: "#828282"
},
tooltip: {
trigger: "axis",
axisPointer: {
type: "line"
}
},
grid: {
left: "3%",
right: "4%",
bottom: "3%",
containLabel: true
},
xAxis: {
type: "value",
// 设置x轴显示几段
min: 0,
max: 100,
interval: 50,
axisTick: { show: false },
axisLine: {
lineStyle: {
color: "transparent"
}
}
},
yAxis: {
type: "category",
data: ["财政收入", "总部经济"],
axisTick: { show: false },
axisLine: {
lineStyle: {
color: "#e0e0e0"
}
},
inside: true,
textStyle: {
color: "#000"
}
},
series: [
{
type: "bar",
itemStyle: {
color: "#f1f1f1",// 定义柱形的背景色
borderRadius:[0, 10, 10, 0] //定义背景柱形的圆角
},
barGap: "-100%", //设置柱形重合的重要步骤
data: [100, 100],
animation: false, // 关闭动画效果
barWidth: "22px",// 设置柱形宽度
},
{
type: "bar",
data: [65, 75],
barWidth: "22px",
barGap: "-100%", //设置柱形重合的重要步骤
itemStyle: {
borderRadius:[0, 10, 10, 0],// 定义柱形的圆角
color: function(params) {
var colorList = ['#3C90EB', '#B573F4', '#F9B341', '#F9B341', '#91c7ae'];
return colorList[params.dataIndex]
}
},
}
]
}
}
},
mounted() {
this.getChartData();
},
methods: {
getChartData() {
let myChart1 = echarts.init(document.querySelector("#myChart1"));
myChart1.setOption(this.option); // 设置图表初始化数据
setTimeout(function() {
window.onresize = function() {
myChart1.resize();// 图表根据窗口大小进行自适应
};
}, 200);
}
}
}
</script>
<style lang="less" scoped>
#myChart1 {
width: 600px;
height: 400px;
}
</style>
以上就是本文的全部内容,希望对大家的学习有所帮助,也希望大家多多支持。
以上是 vue+echarts实现进度条式柱状图 的全部内容, 来源链接: utcz.com/p/239651.html