vue基于echarts实现立体柱形图
立体柱形图是由前面、右面、上面三部分组成,绘制时需要先绘制前面为一个图形,右面和上面绘制为一个图形,然后在echats中注册,在option的series中renderItem中渲染
代码如下:
(1)注册绘制图形
registry () {
let MyCubeRect = this.$echarts.graphic.extendShape({
shape: {
x: 0,
y: 0,
width: 20,
zWidth: 8,
zHeight: 4
},
buildPath: function (ctx, shape) {
const api = shape.api
const xAxisPoint = api.coord([shape.xValue, 0])
const p0 = [shape.x, shape.y]
const p1 = [shape.x - shape.width / 2, shape.y]
const p4 = [shape.x + shape.width / 2, shape.y]
const p2 = [shape.x - shape.width / 2, xAxisPoint[1]]
const p3 = [shape.x + shape.width / 2, xAxisPoint[1]]
ctx.moveTo(p0[0], p0[1])
ctx.lineTo(p1[0], p1[1])
ctx.lineTo(p2[0], p2[1])
ctx.lineTo(p3[0], p3[1])
ctx.lineTo(p4[0], p4[1])
ctx.lineTo(p0[0], p0[1])
ctx.closePath()
}
})
let MyCubeShadow = this.$echarts.graphic.extendShape({
shape: {
x: 0,
y: 0,
width: 20,
zWidth: 8,
zHeight: 4
},
buildPath: function (ctx, shape) {
const api = shape.api
const xAxisPoint = api.coord([shape.xValue, 0])
const p1 = [shape.x - shape.width / 2, shape.y]
const p4 = [shape.x + shape.width / 2, shape.y]
const p6 = [shape.x + shape.width / 2 + shape.zWidth, shape.y - shape.zHeight]
const p7 = [shape.x - shape.width / 2 + shape.zWidth, shape.y - shape.zHeight]
const p3 = [shape.x + shape.width / 2, xAxisPoint[1]]
const p5 = [shape.x + shape.width / 2 + shape.zWidth, xAxisPoint[1] - shape.zHeight]
ctx.moveTo(p4[0], p4[1])
ctx.lineTo(p3[0], p3[1])
ctx.lineTo(p5[0], p5[1])
ctx.lineTo(p6[0], p6[1])
ctx.lineTo(p4[0], p4[1])
ctx.moveTo(p4[0], p4[1])
ctx.lineTo(p6[0], p6[1])
ctx.lineTo(p7[0], p7[1])
ctx.lineTo(p1[0], p1[1])
ctx.lineTo(p4[0], p4[1])
ctx.closePath()
}
})
this.$echarts.graphic.registerShape('MyCubeRect', MyCubeRect)
this.$echarts.graphic.registerShape('MyCubeShadow', MyCubeShadow)
}
(2)渲染图形
barChartOption: {
tooltip: {
trigger: 'axis',
axisPointer: {
type: 'cross',
label: {
backgroundColor: '#6a7985'
}
}
},
grid: {
containLabel: true,
top: '30px',
bottom: '0px',
left: '0px'
},
xAxis: {
type: 'category',
axisLabel: {
interval: 0,
fontSize: fontSize(12)
},
axisLine: {
show: false,
lineStyle: {
color: '#98b9c5'
}
},
data: [] //通过后端传入数据js传入
},
yAxis: {
type: 'value',
axisLabel: {
fontSize: fontSize(12)
},
axisLine: {
show: false,
lineStyle: {
color: '#98b9c5'
}
},
splitLine: {
lineStyle: {
color: '#3a586a',
type: 'dashed'
}
}
},
series: [{
name: '单位面积能耗',
type: 'custom',
renderItem: (params, api) => {
let location = api.coord([api.value(0), api.value(1)])
return {
type: 'group',
children: [{
type: 'MyCubeRect',
shape: {
api,
xValue: api.value(0) - 0.5,
yValue: api.value(1),
x: location[0],
y: location[1]
},
style: api.style()
},
{
type: 'MyCubeShadow',
shape: {
api,
xValue: api.value(0) - 0.5,
yValue: api.value(1),
x: location[0],
y: location[1]
},
style: {
fill: api.style(),
text: ''
}
}]
}
},
stack: '单位面积能耗',
label: {
show: true,
position: 'top',
formatter: '{c}',
textStyle: {
fontSize: fontSize(12),
color: '#fff',
align: 'center'
}
},
itemStyle: {
color: new this.$echarts.graphic.LinearGradient(
0, 0, 0, 1,
[
{ offset: 0, color: '#b1950d' },
{ offset: 0.5, color: '#aea20d' },
{ offset: 1, color: '#a5aa12' }
]
)
},
data: [] //后端传入数据
}]
}
注意事项:
1)、在注册图形时style:只能使用 style: api.style();
text: ''后面才能使用label在图形顶部放置value
2)、this.$echarts是经过统一封装之后的,具体情况还需具体考虑
3)、生成图形
generateBarChart () {
let vm = this
if (this.$refs['uintEnergyConsume']) { //this.$refs是生成图形区域的ref值
this.$echarts.graphic.registerShape('MyCubeRect', this.MyCubeRect)
this.$echarts.graphic.registerShape('MyCubeShadow', this.MyCubeShadow)
this.barChart = this.$echarts.init(this.$refs['uintEnergyConsume'])
this.barChart.setOption(this.barChartOption, false, true)
$(window).resize(function () { //屏幕自适应
vm.handleResize()
})
}
}
(4)template中代码
<div ref="uintEnergyConsume" id="uintEnergyConsume" class="chart-container"
style="width: 100%;" element-loading-text="加载中..."></div>
</div>
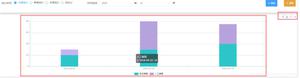
(5)效果如下:
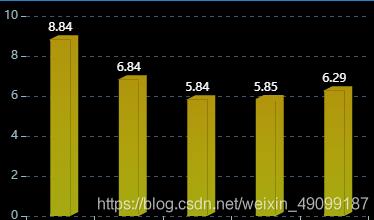
参考图形网址:Vue使用Echarts实现立体柱状图
以上就是本文的全部内容,希望对大家的学习有所帮助,也希望大家多多支持。
以上是 vue基于echarts实现立体柱形图 的全部内容, 来源链接: utcz.com/p/239647.html