echarts插件的饼状图,怎么在后台传进参数去。代码如下
html:
<div id="main" style="margin-left:17% ;width: 600px;height:400px;"></div> js:
var myChart = echarts.init(document.getElementById('main'));option = {
title : {
text: '微信用户来源',
subtext: '',
x:'center'
},
tooltip : {
trigger: 'item',
formatter: "{a} <br/>{b} : {c} ({d}%)"
},
legend: {
orient: 'vertical',
left: 'left',
data: ['山东','北京','内蒙','鞍山','济南']
},
series : [
{
name: '访问来源',
type: 'pie',
radius : '55%',
center: ['50%', '60%'],
data:[
{value:335, name:'山东'},
{value:310, name:'北京'},
{value:234, name:'内蒙'},
{value:135, name:'鞍山'},
{value:1548, name:'济南'}
],
itemStyle: {
emphasis: {
shadowBlur: 10,
shadowOffsetX: 0,
shadowColor: 'rgba(0, 0, 0, 0.5)'
}
}
}
]
};
// 使用刚指定的配置项和数据显示图表。
myChart.setOption(option);
以上js代码里面的数据是写死的。
后台::
JSONArray jsonob = null;Map<String, Object> map =null;
List<Map<String, Object>> list1 = new ArrayList<Map<String,Object>>();
ps=conn.prepareStatement("select total,namec from text");
resl=ps.executeQuery();//返回查询的数量。
while(resl.next()) {
map = new HashMap<String,Object>();
map.put("value", resl.getString("total"));
map.put("name",resl.getString("namec"));
list1.add(map);
}
最后把listl集合存成json格式:
jsonob = JSONArray.fromObject(list1);
我应该怎么把我的数据和饼状图结合起来呢。不知道怎么把我的数据塞进去
回答:
option.series.data = [JSONArray Data] 这样赋值不行?
http://blog.csdn.net/gaogaosh... 看看这个教程
回答:
jquery做ajax请求,请求成功后修改option中的data数据,然后重新setOption
回答:
要么ajax回调填充所需数据,
要么你在后台把格式拼好直接传到前台
回答:
data里面的写一个闭包函数,直接用ajax从后台获取数据,return一个新的数组。类似酱紫:
xAxis : [ {
type : 'category',
data : (function(){
var arr=[];
$.ajax({
type : "post",
async : false, //同步执行
url : "test1.php",
data : {},
dataType : "json", //返回数据形式为json
success : function(result) {
if (result) {
console.log(result);
for(var i=0;i<result.length;i++){
console.log(result[i].name);
arr.push(result[i].name);
}
}
},
error : function(errorMsg) {
alert("sorry,请求数据失败");
myChart.hideLoading();
}
})
return arr;
})()
}
],
简单实例:http://www.cnblogs.com/qjqcs/...
回答:
最近公司正在做这部分功能 我是把整个option去交给后台处理了,ajax去请求 把option作为data直接返回前台 在前台页面直接setOption返回的data
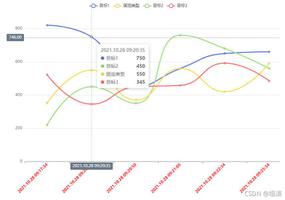
折线图和饼图 map等原理都是一样的
给你个line的例子
后台php
public function getOrderMonthSale(){ $orderMonthTitle = array('text'=>date('n').'月销售额统计',);
$orderMonthToolTip = array('trigger'=>'axis');
$orderMonthLegend = array('data'=>array('有效销售额','无效销售额'));
$orderMonthGrid = array('left'=>'5%','right'=>'3%','top'=>'20%');
$orderMonthToolBox = array('show'=>true,
'feature'=>array('dataZoom'=>array('yAxisIndex'=>'none'),
'dataView'=>array('readOnly'=>false),
'magicType'=>array('type'=>array('line', 'bar')),
'restore'=>array('show'=>true),
'saveAsImage'=>array()
));
$orderMonth_xAxis = array(
'type'=>'category',
'boundaryGap'=>true,
'data'=>array());
$orderMonth_yAxis = array(
'type'=>'value',
'axisLabel'=>array(
'formatter'=>'{value}元'
));
$orderMonth_series = array(
array(
'name'=>'有效销售额',
'type'=>'line',
'smooth'=>true,
'data'=>array(),
'markPoint'=>array(
'data'=>array(
array(
'type'=>'max',
'name'=>'最大值'))),
'markLine'=>array(
'data'=>array(
array(
'type'=>'average',
'name'=>'平均值'))),
'itemStyle'=>array(
'normal'=>array(
'color'=>'#FF7F50',
'lineStyle'=>array(
'color'=>'#FF7F50')))
),
array(
'name'=>'无效销售额',
'type'=>'line',
'smooth'=>true,
'data'=>array(),
'symbol'=> 'emptyCircle',
'markPoint'=>array(
'data'=>array(
array(
'type'=>'max',
'name'=>'最大值')),
),
'markLine'=>array(
'data'=>array(
array(
'type'=>'average',
'name'=>'平均值'))),
),
);
$orderMonthCount = M("*")->field("DATE_FORMAT(FROM_UNIXTIME(add_time),'%d') AS day,COUNT(*) AS count,SUM(*) AS money ")->where("add_time BETWEEN ".$this->month_start." AND ".$this->month_end)->group("day")->order("day ASC")->select();
$orderMonthCountInvalid= M("*")->field("DATE_FORMAT(FROM_UNIXTIME(add_time),'%d') AS day,COUNT(*) AS count,SUM(*) AS money ")->where("add_time BETWEEN ".$this->month_start." AND ".$this->month_end)->group("day")->order("day ASC")->select();
foreach ($orderMonthCount as $key => $value) {
$orderMonthData[intval($value['day'])] = intval($value['money']);
}
foreach ($orderMonthCountInvalid as $key => $value) {
$orderMonthDataInvalid[intval($value['day'])] = intval($value['money']);
}
//$virtualMoneyMonth_X =
for ($i=1; $i <=date('t') ; $i++) {
if(empty($orderMonthData[$i])){
$orderMonthData[$i] = 0;
$orderMonthDataInvalid[$i] = 0;
}
$orderMonthData_xAxis[] = $i;
$orderMonthDataInvalid_xAxis[] = $i;
}
$orderMonth_xAxis['data'] = $orderMonthData_xAxis;
ksort($orderMonthData);
ksort($orderMonthCountInvalid);
$orderMonth_series[0]['data'] = array_values($orderMonthData);
$orderMonth_series[1]['data'] = array_values($orderMonthDataInvalid);
$orderMonth_option['title'] = $orderMonthTitle;
$orderMonth_option['tooltip'] = $orderMonthToolTip;
$orderMonth_option['legend'] = $orderMonthLegend;
$orderMonth_option['grid'] = $orderMonthGrid;
$orderMonth_option['toolbox'] = $orderMonthToolBox;
$orderMonth_option['calculable'] = true;
$orderMonth_option['xAxis'] = $orderMonth_xAxis;
$orderMonth_option['yAxis'] = $orderMonth_yAxis;
$orderMonth_option['series'] = $orderMonth_series;
return $orderMonth_option;
}
前台页面
var orderChartMonth = echarts.init(document.getElementById('order_month')); // 指定图表的配置项和数据
$(function(){
orderChartMonth.showLoading();
$.get("__CONTROLLER__/xxxxxxxxxxxxx").done(function (data) {
orderChartMonth.hideLoading();
// 填入数据
if(data.status == 1){
orderChartMonth.setOption(data.message.orderMonthStats);
orderChartMonth.on('click', function (params) {
console.log(params);
if(params.componentType === 'series') {
setTimeout(function(){
$.ajax({
type:"post",
data: {type:1,change_type:2,date:params.name,index:params.seriesIndex},
url:"__CONTROLLER__/xxxxxxx",
success:function(data){
console.log(data);
layer.open({
type: 1,
skin: 'layui-layer-rim',
title: '订单记录',
fix: false,
shadeClose: true,
maxmin: true,
closeBtn: 1,
area: ['1000px', '700px'],
content: data,
});
}
});
}, 1000);
}else{
//点击其他区域事件
///alert(1);
}
});
回答:
https://github.com/abel533/EC...
这是一个echarts的java类库,很方便的会把数据塞到各种图里
以上是 echarts插件的饼状图,怎么在后台传进参数去。代码如下 的全部内容, 来源链接: utcz.com/p/173201.html