《机器学习实战》中用matplotlib绘制决策树, python3
人笨, 绘制树形图那里的代码看了几次也没看懂(很多莫名其妙的(全局?)变量), 然后就自己想办法写了个
python">import matplotlib.pyplot as pltfrom matplotlib.font_manager import FontProperties
def getTreeDB(mytree):
"""
利用递归获取字典最大深度, 子叶数目
:param mytree:一个字典树, 或者树的子叶节点(字符型)
:return:返回 树的深度, 子叶数目
"""
if not isinstance(mytree, dict): # 如果是子叶节点, 返回1
return 1, 1
depth = [] # 储存每条树枝的深度
leafs = 0 # 结点当前的子叶数目
keys = list(mytree.keys()) # 获取字典的键
if len(keys) == 1: # 如果键只有一个(说明是个结点而不是树枝)
mytree = mytree[keys[0]] # 结点的value一定是树枝(判断的是每条支路的深度而不是结点)
for key in mytree.keys(): # 遍历每条树枝
res = getTreeDB(mytree[key]) # 获取子树的深度, 子叶数目
depth.append(1 + res[0]) # 把每条树枝的深度(加上自身)放在节点的深度集合中
leafs += res[1] # 累积子叶数目
return max(depth), leafs # 返回最大的深度值, 子叶数目
def plotArrow(what, xy1, xy2, which):
"""
画一个带文字描述的箭头, 文字在箭头中间
:param what: 文字内容
:param xy1: 箭头起始坐标
:param xy2: 箭头终点坐标
:param which: 箭头所在的图对象
:return: suprise
"""
# 画箭头
which.arrow(
xy1[0], xy1[1], xy2[0] - xy1[0], xy2[1] - xy1[1],
length_includes_head = True, # 增加的长度包含箭头部分
head_width = 0.15, head_length = 0.5, fc = 'r', ec = 'brown')
tx = (xy1[0] + xy2[0]) / 2
ty = (xy1[1] + xy2[1]) / 2
zhfont = FontProperties(fname = 'msyh.ttc') # 显示中文的方法
# 画文字
which.annotate(
what,
size = 10,
xy = (tx, ty),
xytext = (-5, 5), # 偏移量
textcoords = 'offset points',
bbox = dict(boxstyle = "square", ec = (1., 0.5, 0.5), fc = (1., 0.8, 0.8)), # 外框, fc 内部颜色, ec 边框颜色
fontproperties = zhfont) # 字体
def plotNode(what, xy, which, mod = 'any'):
"""
画树的节点
:param what: 节点的内容
:param xy: 节点的坐标
:param which: 节点所在的图对象
:param mod: 判断节点是子叶还是非子叶(颜色不同)
:return: suprise
"""
zhfont = FontProperties(fname = 'msyh.ttc') # 显示中文的方法, msyh.ttc是微软雅黑的字体文件
if mod == 'leaf':
color = 'yellow'
else:
color = 'greenyellow'
which.text(
xy[0], xy[1],
what, size = 18,
ha = "center", va = "center",
bbox = dict(boxstyle = "round", ec = (1., 0.5, 0.5), fc = color),
fontproperties = zhfont)
def plotInfo(what, which):
"""
提示图中内容
:param what: 子叶标签
:param which: 所在的图对象
:return: suprise
"""
what = '绿色: 特征, 粉红: 特征值, 黄色: ' + what
zhfont = FontProperties(fname = 'msyh.ttc') # 显示中文的方法
which.text(
2, 2,
what, size = 18,
ha = "center", va = "center",
bbox = dict(boxstyle = "round", ec = (1., 0.5, 0.5), fc = '#BB91A6'),
fontproperties = zhfont)
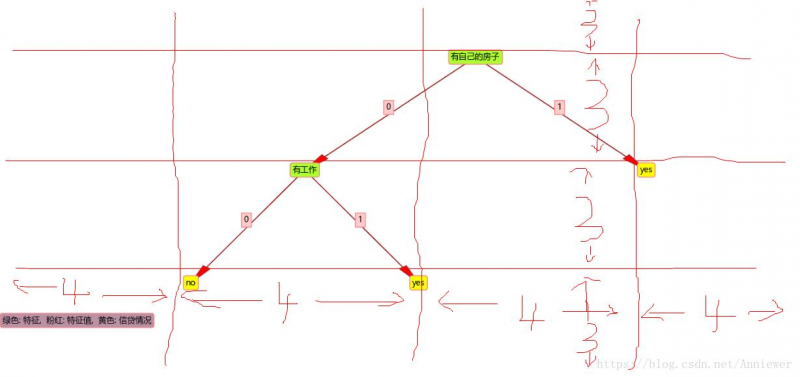
def plotTree(mytree, figxsize, figysize, what):
"""
利用递归画决策树
所有子叶节点两两之间的间距都是xsize
每一层节点之间的间距都是ysize
子叶节点的数目都是确定的, 所以横坐标也是确定的, 从左往右第leafnum个子叶节点的横坐标x = leafs * xsize
非子叶节点的横坐标由该节点孩子的横坐标确定, x = 孩子横坐标平均值
每一层节点的纵坐标由层数deep确定, y = ylen - deep * ysize, 其中ylen为画板高度
:param mytree: 要画的字典树
:param figxsize: 画布的x长度 (两者会影响显示效果)
:param figysize: 画布的y长度 (这两个值很影响树的分布,(不宜过大)(?) ))
:param what: 子叶的标签(用于提示图的结果是什么)
:return: suprise
"""
def plotAll(subtree, deep, leafnum):
"""
内部函数, 递归画图, 会使用外部的变量
:param subtree: 要画的子树
:param deep: 子树根节点所在的深度
:param leafnum: 下一个子叶节点从左到右的排号(用来决定下一个子叶节点的横坐标)
:return:suprise
"""
if not isinstance(subtree, dict): # 如果是子叶节点(非字典)
x = leafnum * xsize # 计算横坐标
y = ylen - deep * ysize # 计算纵坐标
plotNode(subtree, (x, y), ax, 'leaf') # 画节点
return x, y, leafnum + 1 # 返回子叶节点的坐标, 已画子叶数目+1
key = list(subtree.keys()) # 获取子树的根节点的键(节点的名称)
if len(key) != 1: # 传进来的子树应该只有一个根节点
raise TypeError("非字典树") # 不满足就报错
xlist = [] # 储存根节点孩子的横坐标
ylist = [] # 储存根节点孩子的纵坐标
keyvalue = subtree[key[0]] # 根节点的孩子(子字典, 子字典的key为权值, value为子树)
for k in keyvalue: # k为每一格权值(每一个选择)
res = plotAll(keyvalue[k], deep + 1, leafnum) # 获取这个孩子的坐标
leafnum = res[2] # 更新已画的子叶树
xlist.append(res[0]) # 储存孩子的坐标
ylist.append(res[1])
x = sum(xlist) / len(xlist) # 求平均得出该根节点的横坐标
y = ylen - deep * 3 # 计算该根节点的纵坐标
plotNode(key[0], (x, y), ax) # 画该节点
i = 0
for k in keyvalue: # 依次画出根节点与孩子之间的箭头
plotArrow(k, (x, y), (xlist[i], ylist[i]), ax)
i += 1
return x, y, leafnum # 返回该节点的坐标
xsize, ysize = 4, 3 # 默认子叶间距为4, 每层的间距为3 (设置为这两个值的原因...我觉得这样好看些...可以试试别的值)
fig = plt.figure(figsize = (figxsize, figysize)) # 一张画布
axprops = dict(xticks = [], yticks = []) # 横纵坐标显示的数字(设置为空, 不显示)
ax = fig.add_subplot(111, frameon = False, **axprops) # 隐藏坐标轴
depth, leaf = getTreeDB(mytree) # 获取深度, 子叶节点数目
xlen, ylen = 4 * (leaf + 1), 3 * (depth + 1) # 计算横纵间距
ax.set_xlim(0, xlen) # 设置坐标系x, y的范围
ax.set_ylim(0, ylen)
plotAll(mytree, 1, 1) # 画树
plotInfo(what, ax) # 提示标签
plt.show() # show show show show show
testtree = {'有自己的房子': {0: {'有工作': {0: 'no', 1: 'yes'}}, 1: 'yes'}} # 一个树
testlabel = ['年龄', '有工作', '有自己的房子', '信贷情况'] #训练数据的标签
plotTree(testtree, 10, 6, testlabel[-1])
看起来还是不错

代码的注释可能有(fei)点(chang)令人费解... 有问题的地方很多...
测试数据来源 机器学习 决策树算法实战(理论+详细的python3代码实现)
画箭头方法的来源 180122 利用matplotlib绘制箭头的2种方法, 自己改了下颜色,比例
以上是 《机器学习实战》中用matplotlib绘制决策树, python3 的全部内容, 来源链接: utcz.com/a/52175.html


