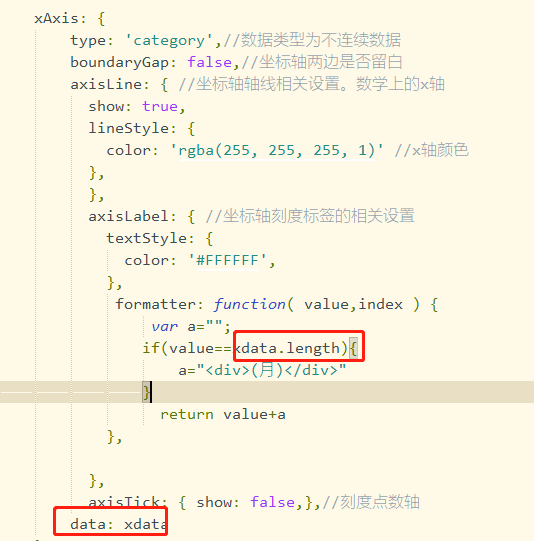
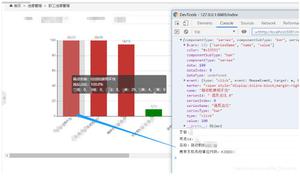
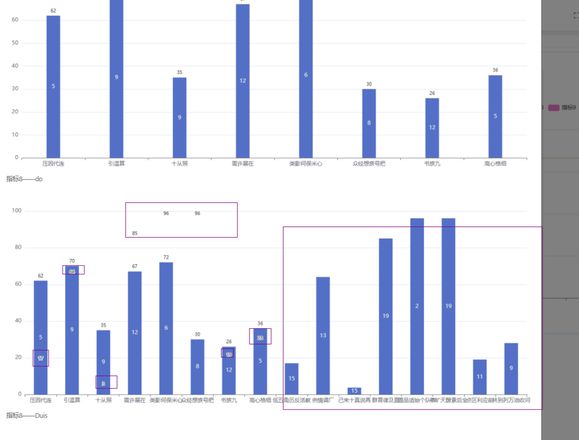
vue echart中 markPoint里formatter返回的值不跟随在柱状图上
for循环动态渲染的柱状图,柱状顶部的值位置不跟随柱子,渲染的第一个是好好的,第二个开始位置就挤在前部分了,也就是第二个图表渲染前几个柱子数量等于第一个柱子数的才有顶部数字
let Charts = document.getElementsByClassName('myChart_x')
let coordItems = [] //值定位显示 let xdeptName = [] //横坐标
let indexItems = [] //柱子上的排名
let Xdata = [] //值
for (let i = 0; i < data.length; i++) {
// 通过for循环,在相同class的dom内绘制元素
let myChart = this.$echarts.init(Charts[i])
data[i].deptList.forEach((v, index) => {
xdeptName.push(v.deptName)
coordItems.push({ coord: [index, v.value] })
indexItems.push(v.index)
Xdata.push(v.value)
})
myChart.setOption({
tooltip: {
trigger: 'axis',
axisPointer: {
type: 'shadow',
},
},
xAxis: {
type: 'category',
axisLabel: {
interval: 0,
},
data: xdeptName,
},
yAxis: {
type: 'value',
},
grid: {
containLabel: true,
left: '1%',
right: '1%',
bottom: '3%',
},
series: [
{
barMaxWidth: 30,
barMinHeight: 15,
type: 'bar',
data: Xdata,
label: {
show: true,
position: 'inside',
formatter: (a) => {
return indexItems[a.dataIndex]
},
},
markPoint: {
symbolSize: 0,
// 定位
data: coordItems,
label: {
fontSize: 10,
show: true,
position: 'top',
formatter: (a) => {
return Xdata[a.dataIndex]
},
},
},
},
],
})
}
以上是 vue echart中 markPoint里formatter返回的值不跟随在柱状图上 的全部内容, 来源链接: utcz.com/p/936365.html