请问如何实现多个echarts图表跟随按键切换?
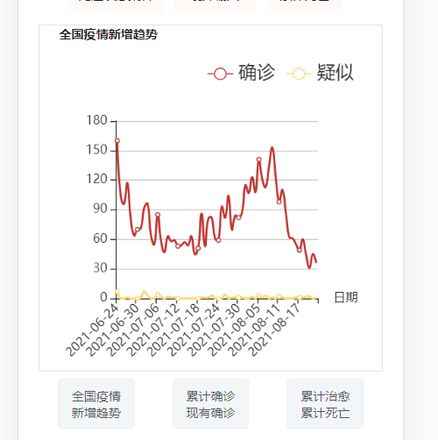
如图想要实现在点击下方div就会切换到相应的echarts图表,可是我现在的情况是:刚开始进入页面能渲染出第一个按钮下的图表(这没问题),点击全国疫情新增趋势能够正常跳转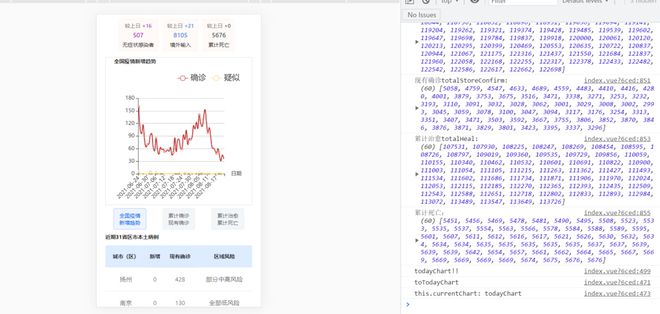 但是点击累计确诊现有确诊后
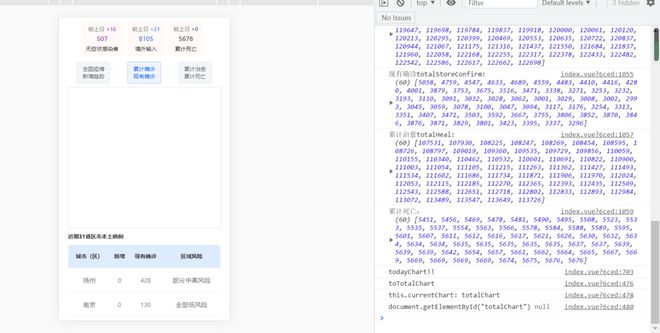 这块突然就空白了
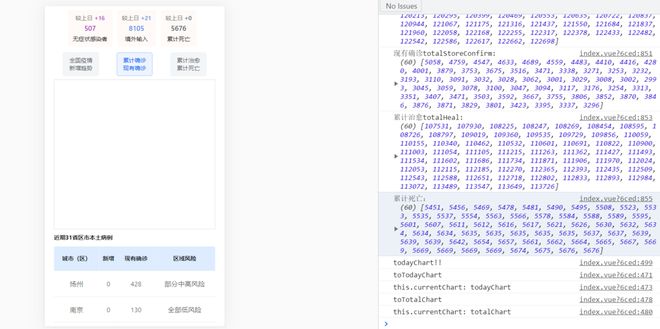 再点击累计治愈和累计死亡,也是空白
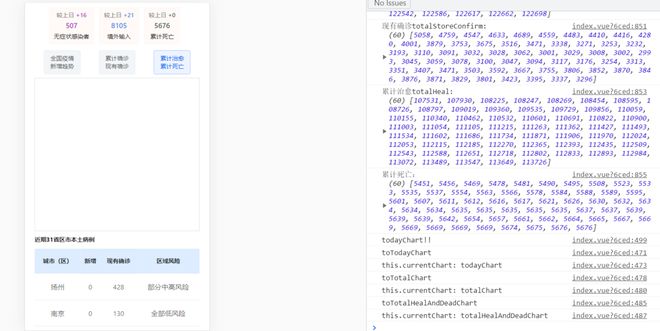 再点击全国疫情新增趋势也全是空白
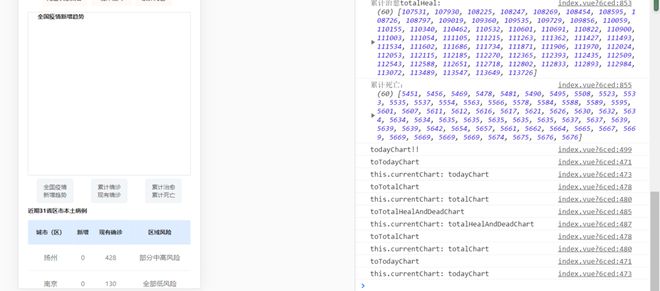 这是什么神奇的事情,同时想请问如何实现下端的div能够随echarts图表的显示而持续呈现高亮的效果,
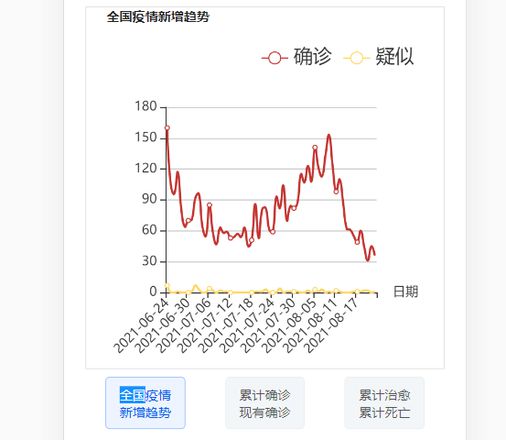 就像这样,请赐教,不胜感激。
<div class="echartsPart" v-if="this.currentChart==='todayChart'" :style="{ marginTop: '0px',border: '1px solid #ddd' }">
<div class="form-title" style="margin-bottom: 2vw;margin-left: 5vw;">
全国疫情新增趋势
</div>
<div
id="todayChart"
:style="{ minWidth: '120px', minHeight: '310px' }"
></div>
</div>
<div id="chartSelection" :style="{display:'flex'}">
<div class="selectionPart" @click="toTodayChart">全国疫情<br/>新增趋势</div>
<div class="selectionPart" @click="toTotalChart">累计确诊<br/>现有确诊</div>
<div class="selectionPart" @click="toTotalHealAndDeadChart">累计治愈<br/>累计死亡</div>
</div>
<div class="echartsPart" v-if="this.currentChart==='totalChart'" :style="{border: '1px solid #ddd'}">
<!-- <div class="form-title" style="margin-bottom:2vw">全国疫情新增趋势</div>-->
<div
id="totalChart"
:style="{ minWidth: '120px', minHeight: '310px' }"
></div>
</div>
<div class="echartsPart" v-if="this.currentChart==='totalHealAndDeadChart'" :style="{ marginTop: '0px',border: '1px solid #ddd' }">
<!-- <div class="form-title" style="margin-bottom:2vw">全国疫情新增趋势</div>-->
<div
id="totalHealAndDeadChart"
:style="{ minWidth: '120px', minHeight: '310px' }"
></div>
</div>
此为涉及的echarts的html代码
mounted() { this.getStatistic();
this.getDataWithTime();
},
methods: {
toTodayChart(){
console.log("toTodayChart")
this.currentChart='todayChart';
console.log("this.currentChart:",this.currentChart)
},
toTotalChart(){
console.log("toTotalChart")
this.currentChart='totalChart';
console.log("this.currentChart:",this.currentChart)
},
toTotalHealAndDeadChart(){
console.log("toTotalHealAndDeadChart")
this.currentChart='totalHealAndDeadChart';
console.log("this.currentChart:",this.currentChart)
},
onChange(a) {
console.log(a);
},
drawLine() {
if(document.getElementById("todayChart")){
console.log("todayChart!!")
var todayChart = echarts.init(document.getElementById("todayChart"));
todayChart.setOption({
grid: {
x: 50,
y: 60,
x2: 40,
y2: 70,
// borderWidth:10
},
// title为图表配置标题
// title: {
// // text: '全国疫情新增趋势',
// x:'center',
// y:'top',
// textAlign:'left',
// },
// 配置提示信息
tooltip: {
trigger: "axis",
},
// tooltip: {},
legend: {
data: ["确诊", "疑似"],
x: "right",
y: "top",
textStyle: {
fontSize: 18,
},
},
// legend图例组件展现了不同系列的标记(symbol),颜色和名字。可以通过点击图例控制哪些系列不显示。
// xAxis配置要在 X 轴显示的项
// xAxis: {
// // data: ["1", "2", "3", "4", "5", "6"]
// data:this.epidemicDataWithTime.date
// },
// 配置要在 Y 轴显示的项。
xAxis: {
data: [],
name: "日期",
axisLabel: {
interval: 5,
rotate: 45,
// margin-top:12
},
},
yAxis: {},
series: [
{
name: "确诊", //系列名称
// type: 'bar', //系列图表类型
// // data:this.epidemicDataWithTime
// data: [5, 20, 36, 10, 10, 20] //系列中的数据内容
type: "line",
data: [],
smooth: true,
},
{
name: "疑似", //系列名称
type: "line",
data: [],
smooth: true,
itemStyle: {
normal: {
color: "rgb(255,214,103)",
},
},
},
],
});
todayChart.showLoading();
todayChart.hideLoading(); //隐藏加载动画
todayChart.setOption({
xAxis: {
data: this.epidemicDataWithTime.date,
},
series: [
{
data: this.epidemicDataWithTime.todayConfirm,
},
{
data: this.epidemicDataWithTime.todaySuspect,
},
],
});
window.onresize = function () {
todayChart.resize();
};
}
if(document.getElementById("totalChart")){
console.log("totalChart")
var totalChart = echarts.init(document.getElementById("totalChart"));
totalChart.setOption({
grid: {
x: 50,
y: 60,
x2: 40,
y2: 70,
// borderWidth:10
},
// title为图表配置标题
// title: {
// // text: '全国疫情新增趋势',
// x:'center',
// y:'top',
// textAlign:'left',
// },
// 配置提示信息
tooltip: {
trigger: "axis",
},
// tooltip: {},
legend: {
data: ["累计确诊", "现有确诊"],
x: "right",
y: "top",
textStyle: {
fontSize: 18,
},
},
// legend图例组件展现了不同系列的标记(symbol),颜色和名字。可以通过点击图例控制哪些系列不显示。
// xAxis配置要在 X 轴显示的项
// xAxis: {
// // data: ["1", "2", "3", "4", "5", "6"]
// data:this.epidemicDataWithTime.date
// },
// 配置要在 Y 轴显示的项。
xAxis: {
data: [],
name: "日期",
axisLabel: {
interval: 5,
rotate: 45,
// margin-top:12
},
},
yAxis: {},
series: [
{
name: "累计确诊", //系列名称
// type: 'bar', //系列图表类型
// // data:this.epidemicDataWithTime
// data: [5, 20, 36, 10, 10, 20] //系列中的数据内容
type: "line",
data: [],
smooth: true,
itemStyle: {
normal: {
color: "rgb(163,29,19)",
},
},
},
{
name: "现有确诊", //系列名称
type: "line",
data: [],
smooth: true,
itemStyle: {
normal: {
color: "rgb(228,74,61)",
},
},
},
],
});
totalChart.showLoading();
totalChart.hideLoading();
totalChart.setOption({
xAxis: {
data: this.epidemicDataWithTime.date,
},
series: [
{
data: this.epidemicDataWithTime.totalConfirm,
},
{
data: this.epidemicDataWithTime.totalStoreConfirm,
},
],
});
window.onresize = function () {
totalChart.resize();
};
}
if(document.getElementById("totalHealAndDeadChart")){
console.log("totalHealAndDeadChart")
var totalHealAndDeadChart = echarts.init(
document.getElementById("totalHealAndDeadChart")
);
totalHealAndDeadChart.setOption({
grid: {
x: 50,
y: 60,
x2: 40,
y2: 70,
// borderWidth:10
},
// title为图表配置标题
// title: {
// // text: '全国疫情新增趋势',
// x:'center',
// y:'top',
// textAlign:'left',
// },
// 配置提示信息
tooltip: {
trigger: "axis",
},
// tooltip: {},
legend: {
data: ["累计治愈", "累计死亡"],
x: "right",
y: "top",
textStyle: {
fontSize: 18,
},
},
// legend图例组件展现了不同系列的标记(symbol),颜色和名字。可以通过点击图例控制哪些系列不显示。
// xAxis配置要在 X 轴显示的项
// xAxis: {
// // data: ["1", "2", "3", "4", "5", "6"]
// data:this.epidemicDataWithTime.date
// },
// 配置要在 Y 轴显示的项。
xAxis: {
data: [],
name: "日期",
axisLabel: {
interval: 5,
rotate: 45,
// margin-top:12
},
},
yAxis: {},
series: [
{
name: "累计治愈", //系列名称
// type: 'bar', //系列图表类型
// // data:this.epidemicDataWithTime
// data: [5, 20, 36, 10, 10, 20] //系列中的数据内容
type: "line",
data: [],
smooth: true,
itemStyle: {
normal: {
color: "rgb(88,169,122)",
},
},
},
{
name: "累计死亡", //系列名称
type: "line",
data: [],
smooth: true,
itemStyle: {
normal: {
color: "rgb(130,130,130)",
},
},
},
],
});
totalHealAndDeadChart.showLoading();
totalHealAndDeadChart.hideLoading();
totalHealAndDeadChart.setOption({
xAxis: {
data: this.epidemicDataWithTime.date,
},
series: [
{
data: this.epidemicDataWithTime.totalHeal,
},
{
data: this.epidemicDataWithTime.totalDead,
},
],
});
window.onresize = function () {
totalHealAndDeadChart.resize();
};
}
// 绘制图表
//显示加载动画
},
}
以上为相关的methods
<template> <div id="epidemicData" style="text-align: center">
<div id="header">
<h1 class="slogan">科学防护 共渡难关</h1>
<h2 class="title1">新型冠状病毒肺炎</h2>
<h1 class="title2">疫情实时追踪</h1>
<h3>数据来源:国家及各级卫健委每日信息发布</h3>
</div>
<div id="content">
<a-menu
v-model="current"
mode="horizontal"
:style="{
borderRadius: '1.667vw 1.667vw 0 0',
backgroundColor: '#ddecff',
fontSize: '2vw',
fontWeight: '400',
color: '#445063',
}"
>
<a-menu-item
key="epidemicData"
@click="toDataPart"
:style="{
width: '50%',
height: '100%',
padding: '0.8vw 0px',
margin: '0px',
}"
>
国内疫情
</a-menu-item>
<a-menu-item
key="knowledge"
:style="{
width: '50%',
height: '100%',
padding: '0.8vw 0px',
margin: '0px',
borderLeft: '1px solid #fff',
borderRadius: '2.667vw 0 0 0',
}"
@click="toKnowledge"
>
防疫须知
</a-menu-item>
</a-menu>
<div v-if="dataPart === false">
<div id="knowledge">
<p class="knowledge-title">新冠肺炎预防须知</p>
<div style="padding-bottom: 1px">
<div class="knowledge-content">
<div class="content-part">
<div class="part-title">
<img
src="../../assets/part1Logo.jpg"
alt="请问如何实现多个echarts图表跟随按键切换?"
class="titleLogo"
/>
<span class="titleItem">个人清洁</span>
</div>
<div class="part-list">
<ul>
<li>经常保持双手清洁,尤其在触摸口、鼻或眼之前。</li>
<li>
经常用洗手液和清水清洗双手,搓手最少20秒,并用纸巾擦干。
</li>
<li>
打喷嚏或咳嗽时应用纸巾掩盖口鼻,把用过的纸巾弃置于有盖垃圾箱内,然后彻底清洁双手。
</li>
</ul>
</div>
</div>
<div class="content-part">
<div class="part-title">
<img
src="../../assets/part2Logo.jpg"
alt="请问如何实现多个echarts图表跟随按键切换?"
class="titleLogo"
/>
<span class="titleItem">尽量避免</span>
</div>
<div class="part-list">
<ul>
<li>
减少前往人流密集的场所。如不可避免,应戴上外科口罩。
</li>
<li>
避免到访医院。如有必要到访医院,应佩戴外科口罩及时刻注重个人和手部卫生。
</li>
<li>
避免接触动物(包括野味)、禽鸟或其粪便;避免到海鲜、活禽市场或农场。
</li>
<li>切勿进食野味及切勿光顾有提供野味的餐馆。</li>
<li>
注意食物安全和卫生,避免进食或饮用生或末熟透的动物产品,包括奶类、蛋类和肉类。
</li>
</ul>
</div>
</div>
<div class="content-part">
<div class="part-title">
<img
src="../../assets/part3Logo.jpg"
alt="请问如何实现多个echarts图表跟随按键切换?"
class="titleLogo"
/>
<span class="titleItem">尽快就诊</span>
</div>
<div class="part-list">
<ul>
<li>
如有身体不适,特别是有发烧或咳嗽,应戴上外科口罩并尽快就诊。
</li>
</ul>
</div>
</div>
</div>
</div>
</div>
</div>
<div v-else>
<div id="card-block">
<div class="statisticalTimes">
统计截至 {{ statisticalTimes }}
</div>
<div id="card">
<div style="display: flex">
<div class="card-item">
<div class="compare">
较上日
<span style="color: #e57631"
>+{{ this.chinaAdd.localConfirmH5 }}</span
>
</div>
<div class="number" style="color: #e57631">
{{ this.chinaTotal.localConfirm }}
</div>
<div class="card-title">本土现有确诊</div>
</div>
<div class="card-item">
<div class="compare">
较上日
<span style="color: #e61c1d">{{
this.chinaAdd.nowConfirm
}}</span>
</div>
<div class="number" style="color: #e61c1d">
{{ this.chinaTotal.nowConfirm }}
</div>
<div class="card-title">现有确诊</div>
</div>
<div class="card-item">
<div class="compare">
较上日
<span style="color: #be2121"
>+{{ this.chinaAdd.confirm }}</span
>
</div>
<div class="number" style="color: #be2121">
{{ this.chinaTotal.confirm }}
</div>
<div class="card-title">累计确诊</div>
</div>
</div>
<div style="display: flex">
<div class="card-item">
<div class="compare">
较上日
<span style="color: #ae3ac6"
>+{{ this.chinaAdd.noInfect }}</span
>
</div>
<div class="number" style="color: #ae3ac6">
{{ this.chinaTotal.noInfect }}
</div>
<div class="card-title">无症状感染者</div>
</div>
<div class="card-item">
<div class="compare">
较上日
<span style="color: #4e8be6"
>+{{ this.chinaAdd.importedCase }}</span
>
</div>
<div class="number" style="color: #4e8be6">
{{ this.chinaTotal.importedCase }}
</div>
<div class="card-title">境外输入</div>
</div>
<div class="card-item">
<div class="compare">
较上日
<span style="color: #4e5a65">+{{ this.chinaAdd.dead }}</span>
</div>
<div class="number" style="color: #4e5a65">
{{ this.chinaTotal.dead }}
</div>
<div class="card-title">累计死亡</div>
</div>
</div>
</div>
</div>
<div class="echartsPart" v-if="this.currentChart==='todayChart'" :style="{ marginTop: '0px',border: '1px solid #ddd' }">
<div class="form-title" style="margin-bottom: 2vw;margin-left: 5vw;">
全国疫情新增趋势
</div>
<div
id="todayChart"
:style="{ minWidth: '120px', minHeight: '310px' }"
></div>
</div>
<div id="chartSelection" :style="{display:'flex'}">
<div class="selectionPart" @click="toTodayChart">全国疫情<br/>新增趋势</div>
<div class="selectionPart" @click="toTotalChart">累计确诊<br/>现有确诊</div>
<div class="selectionPart" @click="toTotalHealAndDeadChart">累计治愈<br/>累计死亡</div>
</div>
<div class="echartsPart" v-if="this.currentChart==='totalChart'" :style="{border: '1px solid #ddd'}">
<!-- <div class="form-title" style="margin-bottom:2vw">全国疫情新增趋势</div>-->
<div
id="totalChart"
:style="{ minWidth: '120px', minHeight: '310px' }"
></div>
</div>
<div class="echartsPart" v-if="this.currentChart==='totalHealAndDeadChart'" :style="{ marginTop: '0px',border: '1px solid #ddd' }">
<!-- <div class="form-title" style="margin-bottom:2vw">全国疫情新增趋势</div>-->
<div
id="totalHealAndDeadChart"
:style="{ minWidth: '120px', minHeight: '310px' }"
></div>
</div>
<div id="dangerousPlaceForm">
<div class="form-header">
<div class="form-title">近期31省区市本土病例</div>
</div>
<a-table
:columns="dangerousPlaceColumns"
:data-source="dangerousPlace"
:pagination="pagination"
:rowKey="(record) => record.name"
:style="{ padding: '10px 0px', margin: '0px', textAlign: 'center' }"
>
<template slot="today.confirm" slot-scope="text, record">
<span v-if="record.today.confirm !== 0" style="color: #ff7f7f"
>+{{ record.today.confirm }}</span
>
<span v-else>{{ record.today.confirm }}</span>
</template>
</a-table>
</div>
<div id="provinceEpidemicDataForm">
<div class="form-header">
<div class="form-title" style="margin-bottom: 2vw">
中国疫情(包括港澳台)
</div>
</div>
<a-table
:columns="provinceEpidemicDataColumns"
childrenColumnName="child"
:data-source="provinceEpidemicData"
:pagination="pagination1"
:rowKey="(record) => record.name"
:style="{ padding: '10px 0px', margin: '0px', textAlign: 'center' }"
>
<span slot="total.nowConfirm" :style="{ backgroundColor: 'red' }"
><a-icon type="smile-o"
/></span>
</a-table>
</div>
<!-- 内部图表大小是与div容器大小相关的,如果想调整图表大小,调整div就可以了-->
<!-- 如果是想调整图表与div间上下左右留白,则设置grid属性就可以了-->
</div>
</div>
</div>
</template>
<script>
import axios from "axios";
import * as echarts from "echarts";
const dangerousPlaceColumns = [
{
title: "城市(区)",
key: "name",
dataIndex: "name",
},
{
title: "新增",
key: "today.confirm",
dataIndex: "today.confirm",
scopedSlots: { customRender: "today.confirm" },
},
{
title: "现有确诊",
key: "total.nowConfirm",
dataIndex: "total.nowConfirm",
// scopedSlots: {customRender: 'action'},
// width: '40%',
},
{
title: "区域风险",
key: "total.grade",
dataIndex: "total.grade",
},
];
const provinceEpidemicDataColumns = [
{
title: "地区",
key: "name",
dataIndex: "name",
},
{
title: "现有",
key: "total.nowConfirm",
dataIndex: "total.nowConfirm",
slots: { title: "total.nowConfirm" },
sorter: (a, b) => {
return a.total.nowConfirm > b.total.nowConfirm ? 1 : -1;
},
},
{
title: "累计",
key: "total.confirm",
dataIndex: "total.confirm",
// defaultSortOrder: 'descend', // 默认上到下为由大到小的顺序
sorter: (a, b) => {
return a.total.confirm > b.total.confirm ? 1 : -1;
},
},
{
title: "治愈",
key: "total.heal",
dataIndex: "total.heal",
// defaultSortOrder: 'descend', // 默认上到下为由大到小的顺序
sorter: (a, b) => {
return a.total.heal > b.total.heal ? 1 : -1;
},
},
{
title: "死亡",
key: "total.dead",
dataIndex: "total.dead",
// defaultSortOrder: 'descend', // 默认上到下为由大到小的顺序
sorter: (a, b) => {
return a.total.dead > b.total.dead ? 1 : -1;
},
},
];
export default {
name: "index",
data() {
return {
currentChart:'todayChart',
current: ["epidemicData"],
dataPart: null,
pagination: {
pageSize: 10,
total: 0,
current: 1,
showTotal: (total) => `共${total}条`, // 显示总数
onChange: (page) => {
console.log("page", page);
this.pagination.current = page;
},
},
pagination1: {
pageSize: 10,
total: 0,
current: 1,
showTotal: (total) => `共${total}条`, // 显示总数
onChange: (page) => {
console.log("page", page);
this.pagination1.current = page;
},
},
provinceEpidemicData: [],
dangerousPlaceColumns,
provinceEpidemicDataColumns,
statisticalTimes: "",
chinaTotal: {
confirm: "",
dead: "",
heal: "",
importedCase: "",
localConfirm: "",
localConfirmH5: "",
local_acc_confirm: "",
noInfect: "",
noInfectH5: "",
nowConfirm: "",
nowSevere: "",
showLocalConfirm: "",
showlocalinfeciton: "",
suspect: "",
},
chinaAdd: {
confirm: "",
dead: "",
heal: "",
importedCase: "",
localConfirm: "",
localConfirmH5: "",
noInfect: "",
noInfectH5: "",
nowConfirm: "",
nowSevere: "",
suspect: "",
},
dangerousPlace: [],
epidemicDataWithTime: {
date: "",
todayConfirm: "",
todaySuspect: "",
totalConfirm: "",
totalStoreConfirm: "",
totalHeal: "",
totalDead: "",
},
};
},
mounted() {
this.getStatistic();
this.getDataWithTime();
},
methods: {
toTodayChart(){
console.log("toTodayChart")
this.currentChart='todayChart';
console.log("this.currentChart:",this.currentChart)
},
toTotalChart(){
console.log("toTotalChart")
this.currentChart='totalChart';
console.log("this.currentChart:",this.currentChart)
},
toTotalHealAndDeadChart(){
console.log("toTotalHealAndDeadChart")
this.currentChart='totalHealAndDeadChart';
console.log("this.currentChart:",this.currentChart)
},
onChange(a) {
console.log(a);
},
drawLine() {
if(document.getElementById("todayChart")){
console.log("todayChart!!")
var todayChart = echarts.init(document.getElementById("todayChart"));
todayChart.setOption({
grid: {
x: 50,
y: 60,
x2: 40,
y2: 70,
// borderWidth:10
},
// title为图表配置标题
// title: {
// // text: '全国疫情新增趋势',
// x:'center',
// y:'top',
// textAlign:'left',
// },
// 配置提示信息
tooltip: {
trigger: "axis",
},
// tooltip: {},
legend: {
data: ["确诊", "疑似"],
x: "right",
y: "top",
textStyle: {
fontSize: 18,
},
},
// legend图例组件展现了不同系列的标记(symbol),颜色和名字。可以通过点击图例控制哪些系列不显示。
// xAxis配置要在 X 轴显示的项
// xAxis: {
// // data: ["1", "2", "3", "4", "5", "6"]
// data:this.epidemicDataWithTime.date
// },
// 配置要在 Y 轴显示的项。
xAxis: {
data: [],
name: "日期",
axisLabel: {
interval: 5,
rotate: 45,
// margin-top:12
},
},
yAxis: {},
series: [
{
name: "确诊", //系列名称
// type: 'bar', //系列图表类型
// // data:this.epidemicDataWithTime
// data: [5, 20, 36, 10, 10, 20] //系列中的数据内容
type: "line",
data: [],
smooth: true,
},
{
name: "疑似", //系列名称
type: "line",
data: [],
smooth: true,
itemStyle: {
normal: {
color: "rgb(255,214,103)",
},
},
},
],
});
todayChart.showLoading();
todayChart.hideLoading(); //隐藏加载动画
todayChart.setOption({
xAxis: {
data: this.epidemicDataWithTime.date,
},
series: [
{
data: this.epidemicDataWithTime.todayConfirm,
},
{
data: this.epidemicDataWithTime.todaySuspect,
},
],
});
window.onresize = function () {
todayChart.resize();
};
}
if(document.getElementById("totalChart")){
console.log("totalChart")
var totalChart = echarts.init(document.getElementById("totalChart"));
totalChart.setOption({
grid: {
x: 50,
y: 60,
x2: 40,
y2: 70,
// borderWidth:10
},
// title为图表配置标题
// title: {
// // text: '全国疫情新增趋势',
// x:'center',
// y:'top',
// textAlign:'left',
// },
// 配置提示信息
tooltip: {
trigger: "axis",
},
// tooltip: {},
legend: {
data: ["累计确诊", "现有确诊"],
x: "right",
y: "top",
textStyle: {
fontSize: 18,
},
},
// legend图例组件展现了不同系列的标记(symbol),颜色和名字。可以通过点击图例控制哪些系列不显示。
// xAxis配置要在 X 轴显示的项
// xAxis: {
// // data: ["1", "2", "3", "4", "5", "6"]
// data:this.epidemicDataWithTime.date
// },
// 配置要在 Y 轴显示的项。
xAxis: {
data: [],
name: "日期",
axisLabel: {
interval: 5,
rotate: 45,
// margin-top:12
},
},
yAxis: {},
series: [
{
name: "累计确诊", //系列名称
// type: 'bar', //系列图表类型
// // data:this.epidemicDataWithTime
// data: [5, 20, 36, 10, 10, 20] //系列中的数据内容
type: "line",
data: [],
smooth: true,
itemStyle: {
normal: {
color: "rgb(163,29,19)",
},
},
},
{
name: "现有确诊", //系列名称
type: "line",
data: [],
smooth: true,
itemStyle: {
normal: {
color: "rgb(228,74,61)",
},
},
},
],
});
totalChart.showLoading();
totalChart.hideLoading();
totalChart.setOption({
xAxis: {
data: this.epidemicDataWithTime.date,
},
series: [
{
data: this.epidemicDataWithTime.totalConfirm,
},
{
data: this.epidemicDataWithTime.totalStoreConfirm,
},
],
});
window.onresize = function () {
totalChart.resize();
};
}
if(document.getElementById("totalHealAndDeadChart")){
console.log("totalHealAndDeadChart")
var totalHealAndDeadChart = echarts.init(
document.getElementById("totalHealAndDeadChart")
);
totalHealAndDeadChart.setOption({
grid: {
x: 50,
y: 60,
x2: 40,
y2: 70,
// borderWidth:10
},
// title为图表配置标题
// title: {
// // text: '全国疫情新增趋势',
// x:'center',
// y:'top',
// textAlign:'left',
// },
// 配置提示信息
tooltip: {
trigger: "axis",
},
// tooltip: {},
legend: {
data: ["累计治愈", "累计死亡"],
x: "right",
y: "top",
textStyle: {
fontSize: 18,
},
},
// legend图例组件展现了不同系列的标记(symbol),颜色和名字。可以通过点击图例控制哪些系列不显示。
// xAxis配置要在 X 轴显示的项
// xAxis: {
// // data: ["1", "2", "3", "4", "5", "6"]
// data:this.epidemicDataWithTime.date
// },
// 配置要在 Y 轴显示的项。
xAxis: {
data: [],
name: "日期",
axisLabel: {
interval: 5,
rotate: 45,
// margin-top:12
},
},
yAxis: {},
series: [
{
name: "累计治愈", //系列名称
// type: 'bar', //系列图表类型
// // data:this.epidemicDataWithTime
// data: [5, 20, 36, 10, 10, 20] //系列中的数据内容
type: "line",
data: [],
smooth: true,
itemStyle: {
normal: {
color: "rgb(88,169,122)",
},
},
},
{
name: "累计死亡", //系列名称
type: "line",
data: [],
smooth: true,
itemStyle: {
normal: {
color: "rgb(130,130,130)",
},
},
},
],
});
totalHealAndDeadChart.showLoading();
totalHealAndDeadChart.hideLoading();
totalHealAndDeadChart.setOption({
xAxis: {
data: this.epidemicDataWithTime.date,
},
series: [
{
data: this.epidemicDataWithTime.totalHeal,
},
{
data: this.epidemicDataWithTime.totalDead,
},
],
});
window.onresize = function () {
totalHealAndDeadChart.resize();
};
}
// 绘制图表
//显示加载动画
},
getDataWithTime() {
console.log("去获取随时间变化的疫情数据");
axios("https://qcmruc.fn.thelarkcloud.com/total-list").then(
({ data }) => {
var dataset = data.data.chinaDayList;
console.log("dataset:", dataset);
const date = [];
const todayConfirm = [];
const todaySuspect = [];
const totalConfirm = [];
const totalStoreConfirm = [];
const totalDead = [];
const totalHeal = [];
for (let i = 0; i < dataset.length; i++) {
date.push(dataset[i].date);
todayConfirm.push(dataset[i].today.confirm);
todaySuspect.push(dataset[i].today.suspect);
totalConfirm.push(dataset[i].total.confirm);
totalStoreConfirm.push(dataset[i].total.storeConfirm);
totalDead.push(dataset[i].total.dead);
totalHeal.push(dataset[i].total.heal);
}
console.log("date:", date);
this.epidemicDataWithTime.date = date;
console.log("新增确诊todayConfirm:", todayConfirm);
this.epidemicDataWithTime.todayConfirm = todayConfirm;
console.log("新增疑似todaysuspect:", todaySuspect);
this.epidemicDataWithTime.todaySuspect = todaySuspect;
console.log("累计的确诊totalConfirm:", totalConfirm);
this.epidemicDataWithTime.totalConfirm = totalConfirm;
console.log("现有确诊totalStoreConfirm:", totalStoreConfirm);
this.epidemicDataWithTime.totalStoreConfirm = totalStoreConfirm;
console.log("累计治愈totalHeal:", totalHeal);
this.epidemicDataWithTime.totalHeal = totalHeal;
console.log("累计死亡:", totalDead);
this.epidemicDataWithTime.totalDead = totalDead;
this.drawLine();
}
);
},
toKnowledge() {
console.log("跳转到防疫须知组件");
this.dataPart = false;
console.log("this.dataPart:", this.dataPart);
},
toDataPart() {
console.log("跳转到数据部分组件");
this.dataPart = null;
console.log("this.dataPart:", this.dataPart);
this.getDataWithTime();
},
getStatistic() {
console.log("去获取疫情数据");
axios("https://qcmruc.fn.thelarkcloud.com/qq-data").then(({ data }) => {
var dataset = eval("(" + data.data + ")");
console.log("获取到的疫情数据:", dataset);
this.statisticalTimes = dataset.lastUpdateTime;
console.log("截止日期:", this.statisticalTimes);
// 获取当前系统时间算间隔
console.log("国内疫情数据:", dataset.chinaTotal);
this.chinaTotal = dataset.chinaTotal;
console.log("较上日变化的数据", dataset.chinaAdd);
this.chinaAdd = dataset.chinaAdd;
const temp = [];
// console.log("中国所有城市列表的长度:",dataset.areaTree[0].children.length)
// console.log("某城市所有区域列表的长度",dataset.areaTree[0].children[4].children.length)
for (let i = 0; i < dataset.areaTree[0].children.length; i++) {
const index = dataset.areaTree[0].children[i];
for (let j = 0; j < index.children.length; j++) {
if (index.children[j].name !== "境外输入") {
// console.log("index.children[j]:",index.children[j].name)
if (
index.children[j].total.grade !== undefined &&
index.children[j].total.nowConfirm !== 0
) {
// console.log("是否有风险等级:",index.children[j].total.grade)
temp.push(index.children[j]);
// console.log("temp:",temp)
}
}
}
}
this.dangerousPlace = temp.sort(
(a, b) => b.today.confirm - a.today.confirm
);
console.log("近期31省市区本土病例:", this.dangerousPlace);
// 新增那一列用插槽,找出所有列表中今天有新增的,用插槽放
const temp1 = [];
for (let i = 0; i < dataset.areaTree[0].children.length; i++) {
const index1 = dataset.areaTree[0].children[i];
temp1.push(index1);
}
this.provinceEpidemicData = temp1;
console.log("国内疫情表:", this.provinceEpidemicData);
});
},
},
};
</script>
<style scoped>
/deep/canvas {
height: 100vw;
width: 30vw;
}
/deep/.ant-table-thead > tr > th {
padding: 16px 1px;
overflow-wrap: break-word;
text-align: center;
background-color: #ddecff;
font-size: 2.5vw;
font-weight: 600;
}
/deep/.ant-table-tbody > tr > td {
padding: 16px 0px;
overflow-wrap: break-word;
text-align: center;
}
/deep/.ant-table-tbody > tr > td.ant-table-column-sort {
background: inherit;
}
h3 {
color: #fff;
margin: 10px auto;
}
h1.slogan {
color: #fff;
font-size: 30px;
position: relative;
top: 15px;
font-weight: bold;
}
h2.title1 {
color: rgb(255, 234, 166);
font-size: 28px;
margin-bottom: 0px;
}
h1.title2 {
font-size: 30px;
color: #fff;
margin: 0px;
padding: 0px;
}
div#header {
/*max-width:1000px;*/
/*margin:0 auto;*/
background: url(../../assets/headerBackground.jpg);
background-size: cover;
position: relative;
min-height: 210px;
}
div#content {
/*max-width:1000px;*/
/*margin:0 auto;*/
position: relative;
margin-top: -20px;
background: #fff;
border-radius: 2.667vw 2.667vw 0 0;
box-shadow: #bbbbbb 0px 0px 10px;
}
div.statisticalTimes {
font-size: 1.4vw;
padding-top: 10px;
text-align: left;
}
div#todayChart,
div#totalChart,
div#totalHealAndDeadChart {
margin: 0px 20px;
padding: 2vw 1vw 0 1vw;
}
div#card-block,
div#dangerousPlaceForm,
div#provinceEpidemicDataForm,
div#knowledge,
div.echartsPart,
div#chartSelection
{
margin: 1.667vw 5.333vw 2vw;
}
div.selectionPart{
margin: 0 5vw;
display: block;
width: 21.333vw;
border: 1px solid #e9ebed;
border-radius: 1.067vw;
font-size: 2.2vw;
line-height: 4.267vw;
text-align: center;
background-color: #f3f6f8;
padding: 2vw 0;
}
div.selectionPart:visited{
background-color: #eef4ff;
border-color: #8fb8ff;
color: #005def;
font-weight: 500;
}
div.selectionPart:hover{
background-color: #eef4ff;
border-color: #8fb8ff;
color: #005def;
font-weight: 500;
}
p.knowledge-title {
color: #222;
font-size: 3.8vw;
font-weight: 600;
margin-top: 1em;
}
img.titleLogo {
width: 4.267vw;
height: 4.267vw;
}
div.part-title {
display: flex;
}
span.titleItem {
font-size: 3vw;
font-weight: bold;
margin-left: 1.667vw;
}
li {
margin-bottom: 1vw;
}
div.part-list {
margin: 2vw 1vw;
font-size: 1.8vw;
}
div.knowledge-content {
margin: 3.333vw 5.333vw 2vw;
border-radius: 1.6vw;
background: #f8f8f8;
padding: 3.333vw 3vw 3vw 3vw;
text-align: left;
}
div.form-title {
text-align: left;
font-size: 2.1vw;
font-weight: 700;
color: #222;
}
div#card {
display: flex;
-ms-flex-wrap: wrap;
flex-wrap: wrap;
-ms-flex-pack: center;
justify-content: center;
-ms-flex-align: center;
align-items: center;
padding-bottom: 1.333vw;
}
div.card-item {
padding: 5px 10px;
margin-top: 10px;
/*width: 21.0vw;*/
/*width:200px;*/
margin-right: 10px;
position: relative;
text-align: center;
background-color: #fffaf7;
padding-bottom: 10px;
}
div.compare {
padding-top: 1.6vw;
color: #7c7c7c;
font-size: 1.967vw;
line-height: 2.667vw;
/*height: 2.667vw;*/
font-weight: 500;
}
div.number {
font-size: 3.867vw;
line-height: 5.867vw;
margin: 5px;
font-weight: 600;
}
div.card-title {
font-size: 2vw;
line-height: 3.2vw;
color: #222;
font-weight: 500;
}
</style>
以上为整体的vue文件
回答:
v-show和v-if有什么区别?使用场景分别是什么?
https://vue3js.cn/interview/v...
回答:
我怎么没看到你二次渲染?给你提供一个方案啊。
抽离一个 chart 组件
- props: [options]
- mounted 里面初始化 echarts
- 外面使用 v-if 切换三个组件的显示隐藏。
你的问题也可以大体的猜一下(你可以改一下多次初始化。)
- 没有二次渲染,导致是空白的。
- 那么为什么第一次渲染没有出来?因为 v-show 的时候元素是看不到的,所以宽高什么的都是没有的。(这也是为什么删掉就能出来。)
- 至于为什么 v-if 也不行,是因为 v-if 的话,第一次就获取不到节点了。
以上是 请问如何实现多个echarts图表跟随按键切换? 的全部内容, 来源链接: utcz.com/p/935999.html


