echarts中怎样实现部分线段画虚线?
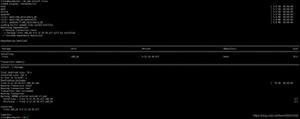
echarts中怎样实现部分线段画虚线?代码如下,目前可设置整体虚线,但不会设置某条线条为虚线。
let charts = {
nodes: [
{ name: '1', value: [0, 700] },
{ name: '2', value: [200, 700] },
{ name: '4', value: [300, 700] },
{ name: '5', value: [400, 700] },
{ name: '9', value: [600, 700] },
{ name: '15', value: [900, 700] },
{ name: '17', value: [960, 700] },
],
linesData: [
{ name: '降水1(10天)', coords: [[20, 700], [190, 700]], type: "dotted" },
{ name: '开挖1\n(5天)', coords: [[220, 700], [290, 700]] },
{ name: '砂石垫层1\n(5天)', coords: [[320, 700], [390, 700]] },
{ name: '混凝土基础1(10天)', coords: [[420, 700], [590, 700]] },
{ name: '混钢筋混凝土安装1(15天)', coords: [[620, 700], [890, 700]] },
{ name: '土方回填1\n(3天)', coords: [[920, 700], [950, 700]] },
]
}
let option = {
xAxis: {
min: 0,
max: 2200,
show: false,
type: "value",
},
yAxis: {
min: 0,
max: 1000,
show: false,
type: "value",
},
grid: {
left: 50,
right: 0,
bottom: 0,
top: 0
},
tooltip: {
show: false,
axisPointer: {
type: "shadow",
},
borderColor: "white",
backgroundColor: "white",
borderWidth: 1,
padding: 5,
textStyle: {
fontSize: 14,
color: '#333',
},
},
series: [
{
type: "graph",
coordinateSystem: "cartesian2d",
symbol: "circle",
symbolSize: [40, 40],
// edgeSymbol: ['', 'arrow'],
// edgeSymbolSize: [1, 10],
lineStyle: {
normal: {
width: 0,
color: 'green',
}
},
itemStyle: {
color: "rgb(194, 194, 194)",
},
symbolOffset: [10, 0],
force: {
edgeLength: 100,
repulsion: 150
},
label: {
show: true,
color: '#333',
},
data: charts.nodes
},
{
type: "lines",
polyline: false,
coordinateSystem: "cartesian2d",
symbol: ['', 'arrow'],
symbolSize: 10,
label: {
show: true,
position: "middle",
fontSize: 16,
color: '#333',
formatter: function (args) {
},
},
lineStyle: {
color: '#65B7E3',
width: 2,
},
data: charts.linesData,
},
],
};
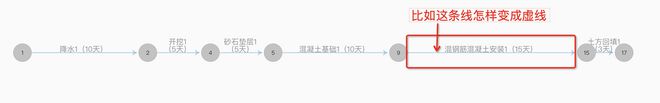
{ name: '混钢筋混凝土安装1(15天)', coords: [[620, 700], [890, 700]] },比如在上面这行代码中是否可设置参数实现虚线呢?
lineStyle中设置type: "dashed"可实现虚线,
回答:
可以在data中对应的元素中单独设置
https://echarts.apache.org/zh/option.html#series-lines.data.l...
以上是 echarts中怎样实现部分线段画虚线? 的全部内容, 来源链接: utcz.com/p/935288.html