echarts使用,页面渲染不出来是什么原因?
<template> <div class="echartscontainer">
<div class="echarts" ref="chartThreeRef" style="width: 600px;height:400px;"></div>
</div>
</template>
<script>
export default {
data () {
return {
chartInstance: null,
alldata: null
}
},
created () {
// this.getAllData()
// this.updateDate()
},
mounted () {
this.initCharts()
},
methods: {
initCharts () {
this.chartInstance = this.$echarts.init(this.$refs.chartThreeRef)
const initOption = {
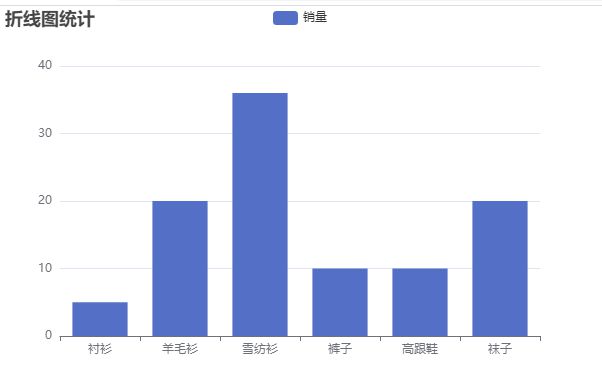
title: {
text: '折线图统计'
},
tooltip: {},
legend: {
data: ['销量']
},
xAxis: {
data: ['衬衫', '羊毛衫', '雪纺衫', '裤子', '高跟鞋', '袜子']
},
yAxis: {},
series: [
{
name: '销量',
type: 'bar',
data: [5, 20, 36, 10, 10, 20]
}
]
}
this.chartInstance.setOption(initOption)
}
回答:
可以出来,你看下你echarts正确引入没有,我这用的echarts5+的版本
import * as echarts from 'echarts'Vue.prototype.$echarts = echarts
<template> <div class="echartscontainer">
<div class="echarts"
ref="chartThreeRef"
style="width: 600px;height:400px;"></div>
</div>
</template>
<script>
export default {
data() {
return {
chartInstance: null,
alldata: null
}
},
created() {
// this.getAllData()
// this.updateDate()
},
mounted() {
this.initCharts()
},
methods: {
initCharts() {
this.chartInstance = this.$echarts.init(this.$refs.chartThreeRef)
const initOption = {
title: {
text: '折线图统计'
},
tooltip: {},
legend: {
data: ['销量']
},
xAxis: {
data: ['衬衫', '羊毛衫', '雪纺衫', '裤子', '高跟鞋', '袜子']
},
yAxis: {},
series: [
{
name: '销量',
type: 'bar',
data: [5, 20, 36, 10, 10, 20]
}
]
}
this.chartInstance.setOption(initOption)
}
}
}
</script>
回答:
<template>
<div class="echartscontainer">
<div class="echarts" ref="chartThreeRef" style="width: 600px; height: 400px"></div></div>
</template>
import * as echarts from "echarts";
data() {
return { chartInstance: null,
alldata: null,
};
},
mounted() {
this.$nextTick(() => { this.initCharts();
});
},
initCharts() {
this.chartInstance = echarts.init(this.$refs.chartThreeRef); const initOption = {
title: {
text: "折线图统计",
},
tooltip: {},
legend: {
data: ["销量"],
},
xAxis: {
data: ["衬衫", "羊毛衫", "雪纺衫", "裤子", "高跟鞋", "袜子"],
},
yAxis: {},
series: [
{
name: "销量",
type: "bar",
data: [5, 20, 36, 10, 10, 20],
},
],
};
this.chartInstance.setOption(initOption);
},
以上是 echarts使用,页面渲染不出来是什么原因? 的全部内容, 来源链接: utcz.com/p/934484.html