解决echarts vue数据更新,视图不更新问题(echarts嵌在vue弹框中)
1.问题描述:在echarts弹框中嵌入echarts,在页面数据改变时,echarts视图不更新;

2.解决办法:
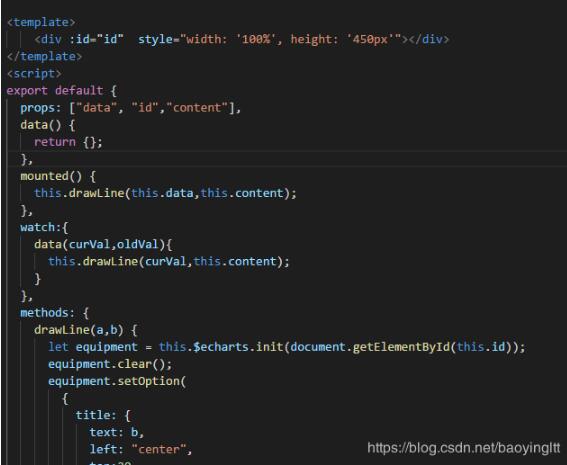
数据更新时以为drawLine()函数在updated()里面执行(这种情况之前碰到过),后来发现热更新之后视图更新了,所以跟周期函数没有关系;参考了一下网上的一些资料,发现可以用vue中的watch()函数来监听数据的更新,一旦数据更新了,那么就在watch()函数中调用drawLine()函数,发现视图更新了,完美解决。
补充知识:vue echarts line动态刷新数据组件
我就废话不多说了,大家还是直接看代码吧~
<template>
<div class="echartLine-wrap">
<div class="echartLine-title">
<img src="@/assets/icon.png" alt />
<div class="text">
<div>{{echartData.title}}</div>
<div>{{echartData.title2}}</div>
<div>{{echartData.title3}}</div>
</div>
</div>
<div ref="lineDom" id="myChart"></div>
</div>
</template>
<script>
export default {
name: "echartLine",
props: {
echartData: {
type: Object,
default: () => {}
}
},
data() {
return {
img: require("../assets/time_bj.png")
};
},
mounted() {
setTimeout(() => {
this.ButtomDrawLine();
}, 500);
},
created() {},
methods: {
ButtomDrawLine() {
let t = this;
let myChart = this.$echarts.init(this.$refs.lineDom);
myChart.setOption({
title: { text: "" },
tooltip: {
trigger: "axis",
borderRadius: 8, //边框圆角
backgroundColor: "rgba(51,204,204,0)", //背景颜色(此时为默认色)
formatter: function(params) {
let value = params[0].value;
let name = params[0].name;
let html = `
<div class='line-html'>
<span>
<span class='active' style="background: ${t.echartData.itemStyle.color}"></span>
${value}
</span>
<span>${t.echartData.title3}</span>
<span></span>
<span>${name}</span>
</div>
`;
return html;
},
textStyle: { color: "#ffff", align: "center", fontSize: 18 }
},
// legend: {
// left: 'right',
// textStyle: {//图例文字的样式
// color: '#ffffff',
// fontSize: 14
// },
// show: true,
// data: [
// {
// name: '审方数',
// },
// {
// name: '处方数',
// },
// {
// name: '会员数'
// },
// {
// name: '含麻登记',
// }
// ]
// },
/*toolbox: {
feature: {
dataView: {readOnly: false},
restore: {},
saveAsImage: {}
},
iconStyle:{
normal:{
color:'white',//设置颜色
}
}
},*/
xAxis: [
{
boundaryGap: true,
type: "category",
axisLine: {
// x轴的颜色和宽度
lineStyle: {
color: "#0070C6"
}
},
axisLabel: {
show: true,
textStyle: {
color: "#fff"
}
},
offset: 0,
nameTextStyle: {
align: "right"
},
axisTick: {
alignWithLabel: true
},
data: t.echartData.XData
}
],
yAxis: [
{
type: "value",
axisLabel: {
show: true,
textStyle: {
color: "#fff"
}
},
axisLine: {
lineStyle: {
color: "#0070C6"
}
},
// 控制网格线是否显示
splitLine: {
show: false
},
min: 0,
splitNumber: 5,
boundaryGap: [0.2, 0.2],
data: [0, 50, 100, 150]
}
],
grid: {
top: "3.5%",
left: "0",
right: "0",
bottom: "0",
containLabel: true
},
series: [
{
name: t.echartData.title,
type: "line",
// smooth: true,
showSymbol: true,
symbolSize: 4, // 拐点图形大小
cursor: "pointer",
areaStyle: {
normal: {
color: new t.$echarts.graphic.LinearGradient(0, 0, 0, 1, [
{
offset: 0,
color: t.echartData.areaStyleColor.fromColor
},
{
offset: 0.4,
color: t.echartData.areaStyleColor.toColor
}
// {
// offset: 1,
// color: "rgba(63,227,236,0.00)"
// }
])
// ['rgba(63,227,236,0.3)'],
}
},
itemStyle: {
color: [t.echartData.itemStyle.color]
},
data: t.echartData.YData,
icon:
"image://http://file.dyzhkj.cn/null/1562315548784PyZcsO处方数.png"
}
// {
// name: '处方数',
// type: 'line',
// smooth: true,
// symbolSize: 1, // 拐点图形大小
// areaStyle: {
// color: new t.$echarts.graphic.LinearGradient(0, 0, 0, 1, [{
// offset: 0,
// color: 'rgba(82,206,86,0.8)'
// }, {
// offset: .4,
// color: 'rgba(82,206,86,0.3)'
// }, {
// offset: 1,
// color: 'rgba(82,206,86,0.00)'
// }])
// // ['rgba(82,206,86,0.3)'],
// },
// itemStyle: {
// normal: {
// color: ['#52CE56'],
// }
// },
// data: [10, 5, 15, 5, 15, 20, 15, 20, 15, 5, 15, 10]
// },
// {
// name: '会员数',
// type: 'line',
// smooth: true,
// symbolSize: 1, // 拐点图形大小
// areaStyle: {
// color: new t.$echarts.graphic.LinearGradient(0, 0, 0, 1, [{
// offset: 0,
// color: 'rgba(251,98,100,0.8)'
// }, {
// offset: .4,
// color: 'rgba(251,98,100,0.3)'
// }, {
// offset: 1,
// color: 'rgba(251,98,100,0.00)'
// }])
// // ['rgba(251,98,100,0.3)'],
// },
// itemStyle: {
// normal: {
// color: ['#FB6264'],
// }
// },
// data: [35, 45, 65, 25, 65, 44, 15, 40, 35, 46, 50, 25]
// },
// {
// name: '含麻登记',
// type: 'bar',
// itemStyle: {
// normal: {
// color: new t.$echarts.graphic.LinearGradient(0, 0, 0, 1, [{
// offset: 0,
// color: 'rgba(231,233,65,0.8)'
// }, {
// offset: .4,
// color: 'rgba(231,233,65,0.3)'
// }, {
// offset: 1,
// color: 'rgba(231,233,65,0.00)'
// }]),
// // ['rgba(231,233,65,0.5)'],
// barBorderColor: '#E7E941', // 柱条边线
// barBorderRadius: 0, // 柱条边线圆角,单位px,默认为0
// barBorderWidth: 1, // 柱条边线线宽,单位px,默认为1
// }
// },
// barWidth: 15,//柱图宽度
// data: [5, 7, 3, 7, 5, 4, 5, 6, 4, 7, 5, 8]
// }
]
});
}
}
};
</script>
<style lang="less">
.line-html {
width: 83.5px;
height: 38px;
text-align: center;
background: url("../assets/line_btn_bj.png") no-repeat;
background-size: 83.5px 38px;
line-height: 42px;
box-sizing: border-box;
position: relative;
font-size: 9px;
padding-right: 2px;
box-sizing: border-box;
.active {
width: 5px;
height: 5px;
border-radius: 50%;
background: #fff;
display: inline-block;
margin-left: 3px;
margin-bottom: 1.5px;
box-sizing: border-box;
}
> span:nth-child(3) {
background: url("../assets/time_bj.png") no-repeat;
background-size: 38.5px 14px;
position: absolute;
top: -5px;
left: 23px;
right: 0;
bottom: 0;
box-sizing: border-box;
}
> span:nth-child(4) {
position: absolute;
top: -19px;
left: 2px;
right: 2px;
bottom: 0;
font-size: 8px;
box-sizing: border-box;
}
}
</style>
<style scoped lang="less">
.echartLine-wrap {
width: 100%;
height: 100%;
.echartLine-title {
width: 100%;
color: #fff;
display: flex;
flex-direction: row;
justify-content: start;
align-items: center;
padding-bottom: 13px;
> img {
width: 7.5px;
height: 14px;
margin-right: 8.5px;
box-sizing: border-box;
}
> .text {
text-align: left;
display: flex;
flex-direction: row;
justify-content: start;
font-size: 12px;
line-height: 1;
align-items: baseline;
> div:nth-child(2) {
font-size: 15px;
margin: 0 5px 0 10px;
font-weight: bold;
box-sizing: border-box;
}
}
}
#myChart {
width: 100%;
height: 165px;
}
}
</style>
调用
//html
<echartLine :echartData="echartData" ref="echartData1" />
//index.js
echartData: {
title: "溶氧",
title2: 3,
title3: "毫克/升",
XData: [1,2,3,4,5,6,7,8,9],
YData: [12,34,56,66,65,77,12,11,33,44],
areaStyleColor: {
fromColor: "#1AB8F9",
toColor: "rgba(63,227,236,0.1)"
},
itemStyle: {
color: "#1AB8F9"
}
}
以上这篇解决echarts vue数据更新,视图不更新问题(echarts嵌在vue弹框中)就是小编分享给大家的全部内容了,希望能给大家一个参考,也希望大家多多支持。
以上是 解决echarts vue数据更新,视图不更新问题(echarts嵌在vue弹框中) 的全部内容, 来源链接: utcz.com/p/237536.html