keras 特征图可视化实例(中间层)
鉴于最近一段时间一直在折腾的CNN网络效果不太理想,主要目标是为了检测出图像中的一些关键点,可以参考人脸的关键点检测算法。
但是由于从数据集的制作是自己完成的,所以数据集质量可能有待商榷,训练效果不好的原因可能也是因为数据集没有制作好(标点实在是太累了)。
于是想看看自己做的数据集在进入到网络后那些中间的隐藏层到底发生了哪些变化。
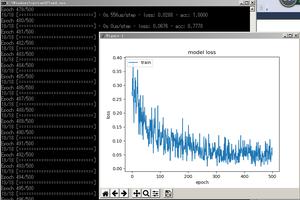
今天主要是用已经训练好的mnist模型来提前测试一下,这里的mnist模型的准确度已经达到了98%左右。
使用的比较简单的一个模型:
def simple_cnn():
input_data = Input(shape=(28, 28, 1))
x = Conv2D(64, kernel_size=3, padding='same', activation='relu', name='conv1')(input_data)
x = MaxPooling2D(pool_size=2, strides=2, name='maxpool1')(x)
x = Conv2D(32, kernel_size=3, padding='same', activation='relu', name='conv2')(x)
x = MaxPooling2D(pool_size=2, strides=2, name='maxpool2')(x)
x = Dropout(0.25)(x)
# 获得最后一层卷积层的输出
# 添加自己的全连接
x = Flatten(name='flatten')(x)
x = Dense(128, activation='relu', name='fc1')(x)
x = Dropout(0.25)(x)
x = Dense(10, activation='softmax', name='fc2')(x)
model = Model(inputs=input_data, outputs=x)
此模型已经训练好了,跑了10个epoch,验证集0.33
这里的效果还是很好的,┓( ´∀` )┏
下面在网上搞了张手写数字
使用网络进行预测,这里就先给出如何可视化第一层的卷积层的输出吧,哇哈哈
代码:
input_data = Input(shape=(28, 28, 1))
x = Conv2D(64, kernel_size=3, padding='same', activation='relu', name='conv1')(input_data)
x = MaxPooling2D(pool_size=2, strides=2, name='maxpool1')(x)
x = Conv2D(32, kernel_size=3, padding='same', activation='relu', name='conv2')(x)
x = MaxPooling2D(pool_size=2, strides=2, name='maxpool2')(x)
x = Dropout(0.25)(x)
x = Flatten(name='flatten')(x)
x = Dense(128, activation='relu', name='fc1')(x)
x = Dropout(0.25)(x)
x = Dense(10, activation='softmax', name='fc2')(x)
model = Model(inputs=input_data, outputs=x)
model.load_weights('final_model_mnist_2019_1_28.h5')
raw_img = cv2.imread('test.png')
test_img = load_img('test.png', color_mode='grayscale', target_size=(28, 28))
test_img = np.array(test_img)
test_img = np.expand_dims(test_img, axis=0)
test_img = np.expand_dims(test_img, axis=3)
conv1_layer = Model(inputs=input_data, outputs=model.get_layer(index=1).output)
conv1_output = conv1_layer.predict(test_img)
for i in range(64):
show_img = conv1_output[:, :, :, i]
print(show_img.shape)
show_img.shape = [28,28]
cv2.imshow('img', show_img)
cv2.waitKey(0)
核心方法就是通过加载模型后,新建Model,将输出部分换为你想要查看的网络层数即可,当然get_layer()包括了name和index两个参数。最后通过遍历当前卷积层的所有特征映射,将每一个都展示出来。就可以了。
以上这篇keras 特征图可视化实例(中间层)就是小编分享给大家的全部内容了,希望能给大家一个参考,也希望大家多多支持。
以上是 keras 特征图可视化实例(中间层) 的全部内容, 来源链接: utcz.com/z/339221.html