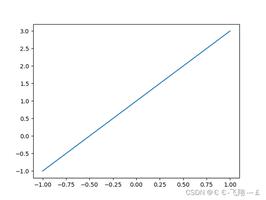
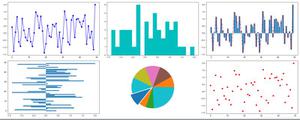
python库matplotlib绘制坐标图
很多时候我们数据处理的时候要画坐标图,下面我用第三方库matplotlib以及scipy绘制光滑的曲线图
需要安装的库有 matplotlib,scipy, numpy
import matplotlib.pyplot as plt
import numpy as np
from mpl_toolkits.axisartist.axislines import Subplot
from scipy import interpolate
def sommth_plot(x_arr, y_arr):
fig = plt.figure() # 创建一个figure
ax = Subplot(fig, 111) # 利用Subplot将figure加入ax
fig.add_axes(ax)
ax.axis['bottom'].set_axisline_style("->", size=1.5) # x轴加上箭头
ax.axis['left'].set_axisline_style("->", size=1.5) # y轴加上上箭头
ax.axis['top'].set_visible(False) # 去除上方坐标轴
ax.axis['right'].set_visible(False) # 去除右边坐标轴
xmin = min(x_arr)
xmax = max(x_arr)
xnew = np.arange(xmin, xmax, 0.0005) # 在最大最小值间以间隔为0.0005插入点
func = interpolate.interp1d(x_arr, y_arr)
ynew = func(xnew) # 得到插入x对应的y值
plt.plot(xnew, ynew, '-') # 绘制图像
plt.show() # show图像
if __name__ == '__main__':
x = eval(input('输入x:'))
y = eval(input('输入y:'))
smooth_plot(x, y)
如果想进一步完善你的图像,可以用以下代码
# 设置图像标题
plt.title('title')
# 设置x范围,y同理
plt.xlim(1, 4)
# 给x,y轴添加说明
plt.xlabel('x')
plt.ylabel('y')
# 设置线条的颜色,宽度,线条样式,标志以及曲线的标签
plt.plot(x, y, color='blue', linewidth=1.0, linestyle='--', marker='o', label='')
# 如果传递了label参量,则使用下面函数使标签显示,loc选择位置,frameon=True标签会在一个框内
plt.legend(loc='upper left', frameon=True)
以上是 python库matplotlib绘制坐标图 的全部内容, 来源链接: utcz.com/z/336163.html


