echarts图的name怎么给某一个值添加下划线?
 这是一个echarts图,现在需要给未掌握后面的数字14114添加一个下划线,应该怎么做?以下是数据源data的代码,现在需要给data的每一项的name里面的a添加一个下划线,查了很多资料感觉实现不了
data: [ {
value: yiZhangwo,
title: '已掌握知识点详情',
name: `{d|已掌握:}{a|${yiZhangwo}}{b|个}{c|\n常考:${mastered.FrequentCount}个\n次常考:${mastered.SubFrequentCount}个\n不常考:${mastered.InfrequentCount}个}`,
label: {
padding: [-22, 0, 0, -100],
width: 100,
rich: {
a: {
color: '#009a82',
fontSize: 20,
lineHeight: 24,
padding: [0, 0, 6, 0],
textDecoration: 'underline',
},
b: {
color: '#009a82',
fontSize: 12,
padding: [0, 0, 6, 0],
},
c: {
color: '#999',
lineHeight: 20,
},
d: {
padding: [0, 0, 6, 0],
},
},
},
labelLine: {
length2: 100,
},
itemStyle: {
color: {
type: 'linear',
x: 0,
y: 1,
x2: 0,
y2: 0,
colorStops: [
{
offset: 0,
color: '#009861', // 0% 处的颜色
},
{
offset: 1,
color: '#1de2c3', // 100% 处的颜色
},
],
global: false, // 缺省为 false
},
},
},
{
value: weiZhangwo,
title: '未掌握知识点详情',
name: `{d|未掌握:}{a|${weiZhangwo}}{b|个}{c|\n常考:${unmastered.FrequentCount}个\n次常考:${unmastered.SubFrequentCount}个\n不常考:${unmastered.InfrequentCount}个}`,
label: {
padding: [-22, -100, 0, 5],
rich: {
a: {
textDecoration: 'underline',
color: '#07f',
fontSize: 20,
lineHeight: 24,
padding: [0, 0, 6, 0],
// borderType: 'solid',
// borderColor:'#07f',
// borderWidth:1,
},
b: {
color: '#07f',
fontSize: 12,
padding: [0, 0, 6, 0],
},
c: {
color: '#999',
lineHeight: 20,
},
d: {
padding: [0, 0, 6, 0],
},
},
formatter: function (params) {
const value = params.value
},
},
labelLine: {
length2: 100,
},
itemStyle: {
color: {
type: 'linear',
x: 0,
y: 1,
x2: 0,
y2: 0,
colorStops: [
{
offset: 0,
color: '#008cff', // 0% 处的颜色
},
{
offset: 1,
color: '#0cf', // 100% 处的颜色
},
],
global: false, // 缺省为 false
},
},
},
],
回答:
加个a标签试试呢
回答:
加boder试试:https://juejin.cn/post/7186919689145024572
回答:
谢邀,一般有两种方案
- 背景图(本回答不考虑)
通过富文本拼接
- 主要因为
rich不支持设置border的上下左右分开设置,希望以后版本能增加吧 - 其实下面
a可以省略,这里只是为了增加边距,有的时候不加下划线可能会黏上去
option = {series: [
{
name: 'Access From',
type: 'pie',
radius: '50%',
data: [
{ value: 1048, name: '名称1' },
{ value: 735, name: '名称2' },
{ value: 580, name: '名称3' },
{ value: 484, name: '名称4' },
{ value: 300, name: '名称5' }
],
label: {
distance: 1,
show:true,
position: 'top',
formatter: function(params){
return '{a|'+params.value+'}'+'\n'+'{b|}'
},
rich:{
a:{
width: 20,
padding:[0,0,4,0]
},
b:{
width:24,
height: 0,
borderWidth:1,
borderColor:'#000'
}
}
},
}
]
};
- 主要因为
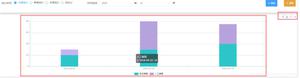
预览效果:
以上是 echarts图的name怎么给某一个值添加下划线? 的全部内容, 来源链接: utcz.com/p/934689.html