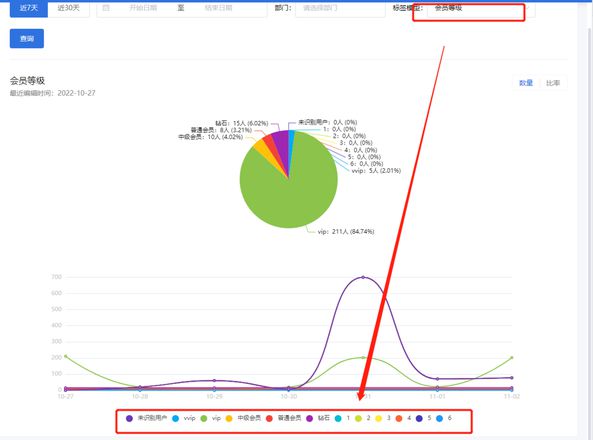
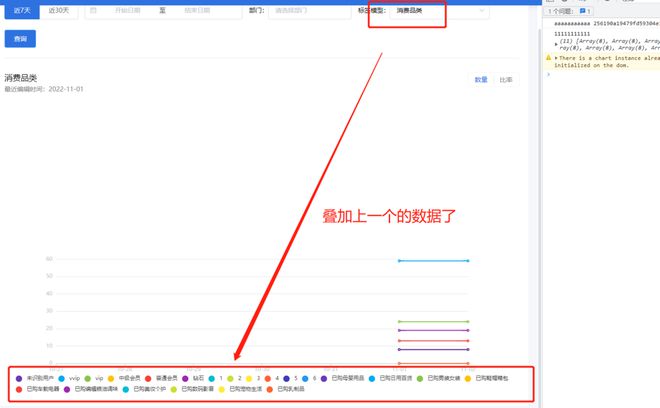
Echarts中联动和共享数据集图表中叠加了上一条的数据?
var chartDom = document.getElementById('main')var myChart = echarts.init(chartDom)
var option = {
color: ['#673AB7', '#02A9F4', '#8BC34B', '#FFC109', '#F44335', '#9D27B0', '#00BCD4', '#CDDD38', '#FFEB3A', '#FF6434', '#403AB5','#2196F3','#4BAF50','#FF9800','#E92662'],
legend: {
icon: "circle",
bottom: '0%'
},
tooltip: {
trigger: 'axis',
showContent: false
},
dataset: {
source: res
},
xAxis: {
type: 'category',
boundaryGap: false,
axisLine:{
lineStyle:{
color: '#C8C8C8' //x轴轴线颜色
}
},
axisLabel: {
color: '#C8C8C8',// x轴字体颜色
}
},
yAxis: {
gridIndex: 0,
axisLine:{
lineStyle:{
color: "#C8C8C8" //x轴轴线颜色
}
}
},
grid: {
top: '55%'
},
series: [
{
type: 'line',
smooth: true,
seriesLayoutBy: 'row',
emphasis: { focus: 'series' }
},
{
type: 'line',
smooth: true,
seriesLayoutBy: 'row',
emphasis: { focus: 'series' }
},
{
type: 'line',
smooth: true,
seriesLayoutBy: 'row',
emphasis: { focus: 'series' }
},
{
type: 'line',
smooth: true,
seriesLayoutBy: 'row',
emphasis: { focus: 'series' }
},
{
type: 'line',
smooth: true,
seriesLayoutBy: 'row',
emphasis: { focus: 'series' }
},
{
type: 'line',
smooth: true,
seriesLayoutBy: 'row',
emphasis: { focus: 'series' }
},
{
type: 'line',
smooth: true,
seriesLayoutBy: 'row',
emphasis: { focus: 'series' }
},
{
type: 'line',
smooth: true,
seriesLayoutBy: 'row',
emphasis: { focus: 'series' }
},
{
type: 'line',
smooth: true,
seriesLayoutBy: 'row',
emphasis: { focus: 'series' }
},
{
type: 'line',
smooth: true,
seriesLayoutBy: 'row',
emphasis: { focus: 'series' }
},
{
type: 'line',
smooth: true,
seriesLayoutBy: 'row',
emphasis: { focus: 'series' }
},
{
type: 'line',
smooth: true,
seriesLayoutBy: 'row',
emphasis: { focus: 'series' }
},
{
type: 'line',
smooth: true,
seriesLayoutBy: 'row',
emphasis: { focus: 'series' }
},
{
type: 'line',
smooth: true,
seriesLayoutBy: 'row',
emphasis: { focus: 'series' }
},
{
type: 'line',
smooth: true,
seriesLayoutBy: 'row',
emphasis: { focus: 'series' }
},
{
type: 'line',
smooth: true,
seriesLayoutBy: 'row',
emphasis: { focus: 'series' }
},
{
type: 'pie',
id: 'pie',
radius: '30%',
center: ['50%', '25%'],
emphasis: {
focus: 'self'
},
label: {
formatter: '{b}:{@[1]}人 ({d}%)',
color: '#000000'
},
encode: {
itemName: 'product',
value: [1],
tooltip: [1]
}
}]
};
myChart.on('updateAxisPointer', function (event) {
// console.log('qqqqqqqqq', event)
const xAxisInfo = event.axesInfo[0]
if (xAxisInfo) {
const dimension = xAxisInfo.value + 1
myChart.setOption({
series: {
id: 'pie',
label: {
formatter: '{b}: {@[' + dimension + ']}人 ({d}%)'
},
encode: {
value: dimension,
tooltip: dimension
}
}
})
}
myChart.setOption(option)
})
option && myChart.setOption(option)
回答:
option && myChart.setOption(option, { notMerge: 'true'})
回答:
只看到了你更新 series:pie 的数据,底下的折线图没有更新。
如果你是公用的一份数据,就可以使用 Dataset - Apache ECharts 这个配置项。
后面你配置的 series 都会按照你配置的 data 获取到对应的数据。
以上是 Echarts中联动和共享数据集图表中叠加了上一条的数据? 的全部内容, 来源链接: utcz.com/p/933341.html


