使用echarts地图,无法在框架中加载?
使用echarts地图,无法在框架中加载,单独调用正常访问,但是在框架里面貌似js运行失败
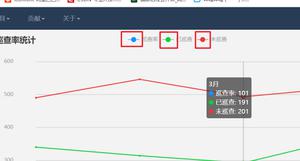
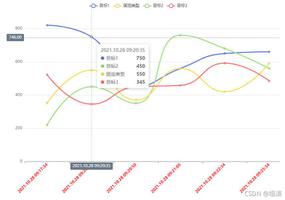
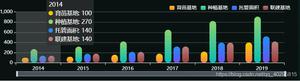
以下为单独调用:
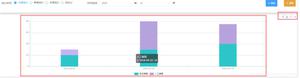
以下为在框架中使用:
代码如下:
<!DOCTYPE html><html lang="en">
<head>
<meta charset="UTF-8">
<meta http-equiv="X-UA-Compatible" content="IE=edge">
<meta name="viewport" content="width=device-width, initial-scale=1.0">
<title>Et使用示例网页</title>
<link rel="stylesheet" type="text/css" href="http://apps.bdimg.com/libs/bootstrap/3.3.4/css/bootstrap.css">
<link rel="stylesheet" href="assets/css/index.css"/>
</head>
<body>
<!--头部-->
<div class="header">
Echart图例使用
<a href="javascript:;" class="a-access">
<button class="button type1">
返回
</button>
</a>
</div>
<!--主体-->
<div class="main clearfix">
<div class="main-left">
<div class="border-container">
<div class="name-title">标题样式</div>
<div id="radar"></div>
<span class="top-left border-span"></span>
<span class="top-right border-span"></span>
<span class="bottom-left border-span"></span>
<span class="bottom-right border-span"></span>
</div>
<div class="border-container" >
<div class="name-title">标题样式</div>
<div id="graduateyear"></div>
<ul class="three-pie clearfix">
<li>
<div id="sexrate"></div>
</li>
<li>
<div id="householdrate"></div>
</li>
</ul>
<span class="top-left border-span"></span>
<span class="top-right border-span"></span>
<span class="bottom-left border-span"></span>
<span class="bottom-right border-span"></span>
</div>
</div>
<div class="main-middle">
<div class="border-container">
<div id="mapadd"></div>
<div class="number-show">
<ul>
<li>
<span class="span-name">第一标准</span>
</li>
<li>
<span class="span-number-show">653</span>
</li>
<li>
<span class="span-name">第二标准</span>
</li>
<li>
<span class="span-number-show">836252</span>
</li>
<li>
<span class="span-name">第三标准</span>
</li>
<li>
<span class="span-number-show">32162</span>
</li>
</ul>
</div>
<span class="top-left border-span"></span>
<span class="top-right border-span"></span>
<span class="bottom-left border-span"></span>
<span class="bottom-right border-span"></span>
</div>
<div class="border-container">
<ul class="teacher-pie clearfix">
<li>
<div class="name-title">标题样式</div>
<div id="courserate"></div>
</li>
<li>
<div class="name-title">标题样式1</div>
<div id="professionrate"></div>
</li>
</ul>
<div class="name-title">标题样式</div>
<div id="changedetail"></div>
<span class="top-left border-span"></span>
<span class="top-right border-span"></span>
<span class="bottom-left border-span"></span>
<span class="bottom-right border-span"></span>
</div>
</div>
<div class="main-right">
<div class="border-container">
<div class="name-title">标题样式</div>
<table class="table table-kingdargen">
<thead>
<tr>
<th>test1</th>
<th>test2</th>
<th>test3</th>
<th>test4</th>
<th>test5</th>
</tr>
</thead>
<tbody>
<tr>
<td>a</td>
<td>268</td>
<td>212</td>
<td>342</td>
<td>256</td>
</tr>
<tr>
<td>b</td>
<td>268</td>
<td>212</td>
<td>342</td>
<td>256</td>
</tr>
<tr>
<td>c</td>
<td>268</td>
<td>212</td>
<td>342</td>
<td>256</td>
</tr>
<tr>
<td>d</td>
<td>268</td>
<td>212</td>
<td>342</td>
<td>256</td>
</tr>
<tr>
<td>e</td>
<td>268</td>
<td>212</td>
<td>342</td>
<td>256</td>
</tr>
<tr>
<td>f</td>
<td>268</td>
<td>212</td>
<td>342</td>
<td>256</td>
</tr>
<tr>
<td>g</td>
<td>268</td>
<td>212</td>
<td>342</td>
<td>256</td>
</tr>
<tr>
<td>h</td>
<td>268</td>
<td>212</td>
<td>342</td>
<td>256</td>
</tr>
<tr>
<td>i</td>
<td>268</td>
<td>212</td>
<td>342</td>
<td>256</td>
</tr>
<tr>
<td>k</td>
<td>268</td>
<td>212</td>
<td>342</td>
<td>256</td>
</tr>
<tr>
<td>k</td>
<td>268</td>
<td>212</td>
<td>342</td>
<td>256</td>
</tr>
<tr>
<td>k</td>
<td>268</td>
<td>212</td>
<td>342</td>
<td>256</td>
</tr>
<tr>
<td>k</td>
<td>268</td>
<td>212</td>
<td>342</td>
<td>256</td>
</tr>
</tbody>
</table>
<span class="top-left border-span"></span>
<span class="top-right border-span"></span>
<span class="bottom-left border-span"></span>
<span class="bottom-right border-span"></span>
</div>
<div class="border-container">
<div class="name-title">标题样式</div>
<div id="juniorservice"></div>
<span class="top-left border-span"></span>
<span class="top-right border-span"></span>
<span class="bottom-left border-span"></span>
<span class="bottom-right border-span"></span>
</div>
<div class="border-container">
<div class="name-title">标题样式 </div>
<div id="edubalance"></div>
<span class="top-left border-span"></span>
<span class="top-right border-span"></span>
<span class="bottom-left border-span"></span>
<span class="bottom-right border-span"></span>
</div>
</div>
</div>
<script src="assets/js/jquery.min.js"></script>
<script src="assets/js/echarts.min.js"></script>
<script src="assets/js/map/shanxi.js"></script>
<!-- 开发环境版本,包含了有帮助的命令行警告 -->
<script src="../../plugins/vue/vue.js"></script>
<!-- 引入组件库 -->
<script src="../../plugins/element-ui/index.js"></script>
<!-- 引入axios -->
<script src="../../plugins/axios/axios.min.js"></script>
<script src="../../js/request.js"></script>
<script src="../../api/member.js"></script>
<script src="../../js/validate.js"></script>
<script src="../../js/index.js"></script>
<script>
new Vue({
data() {
return {}
},
mounted() {
this.getEchartData();
},
created() {
this.getEchartData();
},
methods:{
getEchartData()
{
/*标准*/
var radar = echarts.init(document.getElementById('radar'));
option = {
title: {
text: ''
},
tooltip: {},
legend: {
data: ['第一标准', '第二标准', '第三标准'],
x: "center",
y: 'bottom',
textStyle: {
color: "#fff"
}
},
color: ['#4c95d9', '#f6731b', '#8cd43f'],
radar: {
name: {
textStyle: {
//设置颜色
color: '#fff'
}
},
indicator: [{
name: 'test1',
max: 6500
},
{
name: 'test2',
max: 16000
},
{
name: 'test3',
max: 30000
},
{
name: 'test4',
max: 38000
},
{
name: 'test5',
max: 52000
},
{
name: 'test6',
max: 25000
}
],
center: ['50%', '50%'],
radius: "58%"
},
series: [{
name: '',
type: 'radar',
itemStyle: {
normal: {
splitLine: {
lineStyle: {}
},
label: {
show: false,
textStyle: {},
formatter: function (params) {
return params.value;
}
},
}
},
data: [{
value: [2400, 10000, 28000, 35000, 50000, 19000],
name: '第一标准'
},
{
value: [5000, 14000, 28000, 31000, 42000, 21000],
name: '第二标准'
},
{
value: [6000, 14000, 18000, 21000, 32000, 11000],
name: '第三标准'
}
]
}]
};
radar.setOption(option);
/* 飞鸟尽*/
var graduateyear = echarts.init(document.getElementById('graduateyear'));
option = {
title: {
text: "",
x: 'center',
y: 'top',
textStyle: {
color: '#fff',
fontSize: 13
}
},
tooltip: {
trigger: 'axis'
},
grid: {
left: '3%',
right: '8%',
bottom: '5%',
top: "13%",
containLabel: true
},
color: ["#72b332", '#35a9e0'],
legend: {
data: ['test1', 'test2'],
show: true,
right: '15%',
y: "0",
textStyle: {
color: "#999",
fontSize: '13'
},
},
toolbox: {
show: false,
feature: {
mark: {
show: true
},
dataView: {
show: true,
readOnly: false
},
magicType: {
show: true,
type: ['line', 'bar', 'stack', 'tiled']
},
restore: {
show: true
},
saveAsImage: {
show: true
}
}
},
calculable: true,
xAxis: [{
type: 'category',
boundaryGap: false,
data: ['2022年', '2023年', '2024年', '2025年', '2026年', '2027年', '2028年'],
splitLine: {
show: true,
lineStyle: {
color: '#2d3b53'
}
},
axisLabel: {
textStyle: {
color: "#fff"
},
alignWithLabel: true,
interval: 0,
rotate: '15'
}
}],
yAxis: [{
type: 'value',
splitLine: {
show: true,
lineStyle: {
color: '#2d3b53'
}
},
axisLabel: {
textStyle: {
color: "#999"
}
},
}],
series: [{
name: 'test1',
type: 'line',
smooth: true,
symbol: 'roundRect',
data: [1168, 1189, 1290, 1300, 1345, 1256, 1045]
},
{
name: 'test2',
type: 'line',
smooth: true,
symbol: 'roundRect',
data: [1234, 1290, 1311, 1145, 1045, 900, 673]
}
]
};
graduateyear.setOption(option);
/*==*/
var sexrate = echarts.init(document.getElementById('sexrate'));
var total = {
name: '=='
};
option = {
title: [{
text: total.name,
left: '48%',
top: '34%',
textAlign: 'center',
textBaseline: 'middle',
textStyle: {
color: '#fff',
fontWeight: 'normal',
fontSize: 18
}
}, {
text: total.value,
left: '48%',
top: '44%',
textAlign: 'center',
textBaseline: 'middle',
textStyle: {
color: '#fff',
fontWeight: 'normal',
fontSize: 18
}
}],
tooltip: {
trigger: 'item',
formatter: "{a} <br/>{b} : {c} ({d}%)"
},
color: ['#70a3ff', '#ff7f4e'],
legend: {
orient: 'vertical',
x: 'center',
bottom: '5%',
selectedMode: false,
formatter: function (name) {
var oa = option.series[0].data;
var num = oa[0].value + oa[1].value;
for (var i = 0; i < option.series[0].data.length; i++) {
if (name == oa[i].name) {
return name + " " + oa[i].value + " " + (oa[i].value / num * 100).toFixed(2) +
'%';
}
}
},
data: ['test1', 'test2'],
show: true,
textStyle: {
color: '#fff',
fontWeight: 'bold'
},
},
series: [{
name: 'PK',
type: 'pie',
selectedMode: 'single',
radius: ['45%', '55%'],
center: ['50%', '40%'],
data: [{
value: 2629,
name: 'test1'
},
{
value: 2507,
name: 'test2'
}
],
label: {
normal: {
show: false,
position: "outer",
align: 'left',
textStyle: {
rotate: true
}
}
},
itemStyle: {
emphasis: {
shadowBlur: 10,
shadowOffsetX: 0,
shadowColor: 'rgba(0, 0, 0, 0.5)'
},
normal: {
label: {
show: true,
formatter: '{b} {c}'
}
}
}
}]
};
sexrate.setOption(option);
var householdrate = echarts.init(document.getElementById('householdrate'));
var total = {
name: '=='
};
option = {
title: [{
text: total.name,
left: '48%',
top: '34%',
textAlign: 'center',
textBaseline: 'middle',
textStyle: {
color: '#fff',
fontWeight: 'normal',
fontSize: 18
}
}, {
text: total.value,
left: '48%',
top: '44%',
textAlign: 'center',
textBaseline: 'middle',
textStyle: {
color: '#fff',
fontWeight: 'normal',
fontSize: 18
}
}],
tooltip: {
trigger: 'item',
formatter: "{a} <br/>{b} : {c} ({d}%)"
},
color: ['#4f9de7', '#4acf79'],
legend: {
orient: 'vertical',
x: 'center',
bottom: '5%',
selectedMode: false,
formatter: function (name) {
var oa = option.series[0].data;
var num = oa[0].value + oa[1].value;
for (var i = 0; i < option.series[0].data.length; i++) {
if (name == oa[i].name) {
return name + " " + oa[i].value + " " + (oa[i].value / num * 100).toFixed(2) +
'%';
}
}
},
data: ['test1', 'test2'],
show: true,
textStyle: {
color: '#fff',
fontWeight: 'bold'
},
},
series: [{
name: 'FK',
type: 'pie',
selectedMode: 'single',
radius: ['45%', '55%'],
center: ['50%', '40%'],
data: [{
value: 2629,
name: 'test1'
},
{
value: 2507,
name: 'test2'
}
],
label: {
normal: {
show: false,
position: "outer",
align: 'left',
textStyle: {
rotate: true
}
}
},
itemStyle: {
emphasis: {
shadowBlur: 10,
shadowOffsetX: 0,
shadowColor: 'rgba(0, 0, 0, 0.5)'
},
normal: {
label: {
show: true,
formatter: '{b} {c}'
}
}
}
}]
};
householdrate.setOption(option);
/* =====-=*/
var courserate = echarts.init(document.getElementById('courserate'));
option = {
tooltip: {
trigger: 'item',
formatter: "{a} <br/>{b} : {c} ({d}%)"
},
legend: {
orient: 'vertical',
right: '0',
y: 'middle',
textStyle: {
color: "#fff"
},
formatter: function (name) {
var oa = option.series[0].data;
var num = oa[0].value + oa[1].value + oa[2].value + oa[3].value + oa[4].value + oa[5]
.value;
for (var i = 0; i < option.series[0].data.length; i++) {
if (name == oa[i].name) {
return name + ' ' + oa[i].value;
}
}
},
data: ['test1', 'test2', 'test3', 'test4', 'test5', 'text6']
},
series: [{
name: 'FK',
type: 'pie',
radius: '45%',
color: ['#27c2c1', '#9ccb63', '#fcd85a', '#60c1de', '#0084c8', '#d8514b'],
center: ['38%', '50%'],
data: [{
value: 335,
name: 'test1'
},
{
value: 310,
name: 'test2'
},
{
value: 234,
name: 'test3'
},
{
value: 135,
name: 'test4'
},
{
value: 234,
name: 'test5'
},
{
value: 234,
name: 'text6'
}
],
itemStyle: {
emphasis: {
shadowBlur: 10,
shadowOffsetX: 0,
shadowColor: 'rgba(0, 0, 0, 0.5)'
}
},
itemStyle: {
normal: {
label: {
show: true,
position: 'outside',
formatter: '{b}'
}
},
labelLine: {
show: true
}
}
}]
};
courserate.setOption(option);
/* =======*/
var professionrate = echarts.init(document.getElementById('professionrate'));
option = {
tooltip: {
trigger: 'item',
formatter: "{a} <br/>{b} : {c} ({d}%)"
},
legend: {
orient: 'vertical',
right: '0',
y: 'middle',
textStyle: {
color: "#fff"
},
data: ['test1', 'test2', 'test3'],
formatter: function (name) {
var oa = option.series[0].data;
var num = oa[0].value + oa[1].value + oa[2].value;
for (var i = 0; i < option.series[0].data.length; i++) {
if (name == oa[i].name) {
return name + ' ' + oa[i].value;
}
}
}
},
series: [{
name: 'FK',
type: 'pie',
radius: '60%',
center: ['35%', '50%'],
data: [{
value: 335,
name: 'test1'
},
{
value: 310,
name: 'test2'
},
{
value: 234,
name: 'test3'
}
],
itemStyle: {
emphasis: {
shadowBlur: 10,
shadowOffsetX: 0,
shadowColor: 'rgba(0, 0, 0, 0.5)'
}
},
itemStyle: {
normal: {
label: {
show: true,
position: 'outside',
formatter: ' {b}'
}
},
labelLine: {
show: true
}
}
}]
};
professionrate.setOption(option);
/* 比例变化*/
var changedetail = echarts.init(document.getElementById('changedetail'));
option = {
tooltip: {
trigger: 'axis',
formatter: '{b}</br>{a}: {c}</br>{a1}: {c1}'
},
toolbox: {
show: false,
feature: {
dataView: {
show: true,
readOnly: false
},
magicType: {
show: true,
type: ['line', 'bar']
},
restore: {
show: true
},
saveAsImage: {
show: true
}
}
},
legend: {
data: ['', ''],
show: false
},
grid: {
top: '18%',
right: '5%',
bottom: '8%',
left: '5%',
containLabel: true
},
xAxis: [{
type: 'category',
data: ['2021年', '2022年', '2023年', '2024年', '2025年'],
splitLine: {
show: false,
lineStyle: {
color: '#3c4452'
}
},
axisTick: {
show: false
},
axisLabel: {
textStyle: {
color: "#fff"
},
lineStyle: {
color: '#519cff'
},
alignWithLabel: true,
interval: 0
}
}],
yAxis: [{
type: 'value',
name: '嘎嘎',
nameTextStyle: {
color: '#fff'
},
interval: 5,
max: 50,
min: 0,
splitLine: {
show: true,
lineStyle: {
color: '#23303f'
}
},
axisLine: {
show: false,
lineStyle: {
color: '#115372'
}
},
axisTick: {
show: false
},
axisLabel: {
textStyle: {
color: "#fff"
},
alignWithLabel: true,
interval: 0
}
},
{
min: 0,
max: 2.5,
interval: 0.5,
type: 'value',
name: '哈哈',
nameTextStyle: {
color: '#fff'
},
splitLine: {
show: true,
lineStyle: {
color: '#23303f'
}
},
axisLine: {
show: false,
lineStyle: {
color: '#115372'
}
},
axisTick: {
show: false
},
axisLabel: {
textStyle: {
color: "#fff"
},
alignWithLabel: true,
interval: 0
}
}
],
color: "yellow",
series: [{
name: 'test1',
type: 'bar',
data: [2, 4, 7, 23, 25],
boundaryGap: '45%',
barWidth: '40%',
itemStyle: {
normal: {
color: function (params) {
var colorList = [
'#6bc0fb', '#7fec9d', '#fedd8b', '#ffa597', '#84e4dd'
];
return colorList[params.dataIndex]
},
label: {
show: true,
position: 'top',
formatter: '{c}'
}
}
}
},
{
name: 'test2',
type: 'line',
yAxisIndex: 1,
lineStyle: {
normal: {
color: '#c39705'
}
},
data: [1.0, 0.5, 0.8, 0.9, 0.6]
}
]
};
changedetail.setOption(option);
/* ===*/
var juniorservice = echarts.init(document.getElementById('juniorservice'));
option = {
tooltip: {
trigger: 'axis',
axisPointer: { // 坐标轴指示器,坐标轴触发有效
type: 'shadow' // 默认为直线,可选为:'line' | 'shadow'
}
},
color: ['#eaff00', '#22ac38'],
legend: {
right: '0',
data: ['test1', 'test2'],
textStyle: {
color: '#00ffff'
}
},
grid: {
left: '8%',
right: '4%',
bottom: '3%',
top: '10%',
containLabel: true
},
xAxis: {
type: 'value',
splitLine: {
show: true,
lineStyle: {
color: '#1e2b43'
}
},
axisLine: {
show: false,
lineStyle: {
color: '#115372'
}
},
axisTick: {
show: false
},
axisLabel: {
textStyle: {
color: "#fff"
},
alignWithLabel: true,
interval: 0
}
},
dataZoom: [{
type: 'slider',
yAxisIndex: 0,
filterMode: 'empty',
start: 0,
x: '0',
end: 60,
handleStyle: {
color: "#519cff",
backgroundColor: '#519cff'
},
textStyle: {
color: "#fff"
},
borderColor: "#519cff"
}],
yAxis: {
type: 'category',
data: ['a', 'b', 'c', ' d', 'e', 'f', 'g', 'h', 'i', 'j', ' k', 'l', 'm', 'n'],
splitLine: {
show: false,
lineStyle: {
color: '#1e2b43'
}
},
axisTick: {
show: false
},
axisLine: {
show: true,
lineStyle: {
color: '#115372'
}
},
axisLabel: {
textStyle: {
color: "#419aff"
},
lineStyle: {
color: '#519cff'
},
alignWithLabel: true,
interval: 0
}
},
series: [{
name: 'test1',
type: 'bar',
stack: '比例',
label: {
normal: {
show: true,
position: 'insideRight',
textStyle: {
color: '#333'
}
}
},
data: [320, 302, 301, 334, 390, 330, 320, 320, 302, 301, 334, 390, 330, 123]
},
{
name: 'test2',
type: 'bar',
stack: '比例',
label: {
normal: {
show: true,
position: 'right',
textStyle: {
color: '#00f0ff'
}
}
},
data: [120, 132, 101, 134, 90, 230, 210, 120, 132, 101, 134, 90, 230, 243]
}
]
};
juniorservice.setOption(option);
/* ===*/
var edubalance = echarts.init(document.getElementById('edubalance'));
option = {
tooltip: {
trigger: 'axis',
formatter: '{b}</br>{a}: {c}</br>{a1}: {c1}</br>{a2}: {c2}</br>{a3}: {c3}'
},
toolbox: {
show: false,
feature: {
dataView: {
show: true,
readOnly: false
},
magicType: {
show: true,
type: ['line', 'bar']
},
restore: {
show: true
},
saveAsImage: {
show: true
}
}
},
legend: {
data: ['test1', 'test2', 'test3', 'test4', 'test5'],
right: "15%",
textStyle: {
color: '#fff'
}
},
grid: {
top: '18%',
right: '5%',
bottom: '8%',
left: '5%',
containLabel: true
},
xAxis: [{
type: 'category',
data: ['工藤新一', '工藤新一', '工藤新一', '工藤新一'],
splitLine: {
show: false,
lineStyle: {
color: '#3c4452'
}
},
axisTick: {
show: false
},
axisLabel: {
textStyle: {
color: "#fff"
},
lineStyle: {
color: '#519cff'
},
alignWithLabel: true,
interval: 0,
}
}],
yAxis: [{
type: 'value',
nameTextStyle: {
color: '#fff'
},
interval: 5,
max: 50,
min: 0,
splitLine: {
show: true,
lineStyle: {
color: '#23303f'
}
},
axisLine: {
show: false,
lineStyle: {
color: '#115372'
}
},
axisTick: {
show: false
},
axisLabel: {
textStyle: {
color: "#fff"
},
alignWithLabel: true,
interval: 0
}
},
{
min: 0,
max: 100,
interval: 20,
type: 'value',
name: '所',
nameTextStyle: {
color: '#fff'
},
splitLine: {
show: true,
lineStyle: {
color: '#23303f'
}
},
axisLine: {
show: false,
lineStyle: {
color: '#115372'
}
},
axisTick: {
show: false
},
axisLabel: {
textStyle: {
color: "#fff"
},
alignWithLabel: true,
interval: 0
}
}
],
color: "yellow",
series: [{
name: 'test1',
type: 'bar',
data: [21, 14, 17, 12],
itemStyle: {
normal: {
color: '#76da91'
},
label: {
show: true,
position: 'top',
formatter: '{c}'
}
}
},
{
name: 'test2',
type: 'bar',
data: [12, 14, 17, 23],
itemStyle: {
normal: {
color: '#f8cb7f'
},
label: {
show: true,
position: 'top',
formatter: '{c}'
}
}
},
{
name: 'test3',
type: 'bar',
data: [12, 14, 17, 13],
itemStyle: {
normal: {
color: '#f89588'
},
label: {
show: true,
position: 'top',
formatter: '{c}'
}
}
},
{
name: 'test4',
type: 'bar',
data: [2, 4, 7, 3],
itemStyle: {
normal: {
color: '#7cd6cf'
},
label: {
show: true,
position: 'top',
formatter: '{c}'
}
}
},
{
name: 'test5',
type: 'line',
yAxisIndex: 1,
lineStyle: {
normal: {
color: '#c39705'
}
},
data: [30, 10, 90, 75]
}
]
};
edubalance.setOption(option);
/* 地图 需要哪个省市的地图直接引用js 将下面的name以及mapType修改为对应省市名称*/
var maps = echarts.init(document.getElementById('mapadd'));
option = {
tooltip: {
trigger: 'item',
formatter: '{b}<br />{c}'
},
series: [{
name: '山西',
type: 'map',
mapType: '山西',
roam: false,
top: '8%',
zoom: 1.2,
x: '25%',
selectedMode: 'single', //multiple多选
itemStyle: {
normal: {
label: {
show: true,
textStyle: {
color: "#231816"
}
},
areaStyle: {
color: '#B1D0EC'
},
color: '#B1D0EC',
borderColor: '#dadfde' //区块的边框颜色
},
emphasis: { //鼠标hover样式
label: {
show: true,
textStyle: {
color: '#fa4f04'
}
},
areaStyle: {
color: 'red'
}
}
},
data: [{
name: '大同市',
value: 234,
itemStyle: {
normal: {
areaColor: '#13d5ff',
borderColor: '#edce00',
}
}
},
{
name: '朔州市',
itemStyle: {
normal: {
areaColor: '#13d5ff',
borderColor: '#0abcee'
}
}
},
{
name: '忻州市',
itemStyle: {
normal: {
areaColor: '#92d050',
borderColor: '#1ca9f2'
}
}
},
{
name: '吕梁市',
itemStyle: {
normal: {
areaColor: '#88ddf5',
borderColor: '#88ddf5',
}
}
},
{
name: '太原市',
itemStyle: {
normal: {
areaColor: '#13d5ff',
borderColor: '#45b5ef',
}
}
},
{
name: '阳泉市',
itemStyle: {
normal: {
areaColor: '#13d5ff',
borderColor: '#45b5ef'
}
}
},
{
name: '晋中市',
itemStyle: {
normal: {
areaColor: '#45b5ef',
borderColor: '#45b5ef',
}
}
},
{
name: '长治市',
itemStyle: {
normal: {
areaColor: '#ffd811',
borderColor: '#45b5ef',
}
}
},
{
name: '临汾市',
itemStyle: {
normal: {
areaColor: '#92d050',
borderColor: '#1ca9f2'
}
}
},
{
name: '晋城市',
itemStyle: {
normal: {
areaColor: '#88ddf5',
borderColor: '#88ddf5',
}
}
},
{
name: '运城市',
itemStyle: {
normal: {
areaColor: '#13d5ff',
borderColor: '#45b5ef',
}
}
}
]
}]
};
maps.setOption(option);
}
}
})
</script>
</body>
</html>
还请各位论坛的大佬指教一下问题在哪里,谢谢
回答:
mounted() { this.$nextTick(function () {
this.getEchartData();
})
}
这样不行吗?
以上是 使用echarts地图,无法在框架中加载? 的全部内容, 来源链接: utcz.com/p/933294.html