echarts柱状图使用dataset,如何让两种数据对应两个y轴,并且高度也是跟随对应的y轴变化
问题描述
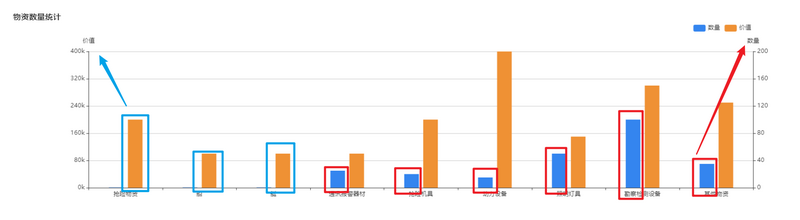
echarts柱状图使用dataset,一种是图中蓝色的长方形,想要对应右侧的y轴,另一种是黄色的长方形想要对应左侧的y轴。现在双Y轴都已经设置好,但是如何让两种数据对应两个y轴,并且高度也是跟随对应的y轴变化。(例如最高的蓝色长方形数据已经是200了,但它的高度其实是看的左侧的y轴,所以并没有到顶)
问题截图
option配置项代码如下
option = {legend: {
right: '10%'
},
tooltip: {},
dataset: {
dimensions: ['name', 'num', 'worth'],
source: data
},
xAxis: { type: 'category' },
yAxis: [
{
name: '价值',
type: 'value',
min: 0,
max: 400,
interval: Math.ceil(400 / 5),
axisLabel: {
formatter: '{value}k' //自定义y轴坐标轴的刻度标签
}
},
{
name: '数量',
type: 'value',
min: 0,
max: 200,
interval: Math.ceil(200 / 5),
axisLabel: {
formatter: '{value}'
}
},
],
// Declare several bar series, each will be mapped
// to a column of dataset.source by default.
series: [
{ name: '数量', type: 'bar', barWidth: 30, },
{ name: '价值', type: 'bar', barWidth: 30, },
],
color: ['#3485ef', '#ef9134'],
}
回答
series 的第一项里,加个 yAxisIndex: 1 指定一下 Y 轴就好了
以上是 echarts柱状图使用dataset,如何让两种数据对应两个y轴,并且高度也是跟随对应的y轴变化 的全部内容, 来源链接: utcz.com/p/27959.html