vue实现横向斜切柱状图
本文实例为大家分享了vue实现横向斜切柱状图的具体代码,供大家参考,具体内容如下
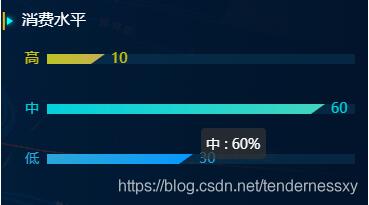
实现效果:
实现代码:
<template>
<div class="Consumption">
<div style="width: 350px; height: 180px" ref="ConsumptionChart" />
</div>
</template>
<script>
import echarts from 'echarts'
const myShape = {
x: 0,
y: 0,
width: 10 //间距
}
// 绘制左侧面
const InclinedRoofBar = echarts.graphic.extendShape({
shape: myShape,
buildPath: function(ctx, shape) {
// 会canvas的应该都能看得懂,shape是从custom传入的
const xAxisPoint = shape.xAxisPoint
const c0 = [shape.x, shape.y]
const c1 = [shape.x + 14, shape.y - 10]
const c2 = [xAxisPoint[0], xAxisPoint[1] - 10]
const c3 = [xAxisPoint[0], xAxisPoint[1]]
ctx
.moveTo(c0[0], c0[1])
.lineTo(c1[0], c1[1])
.lineTo(c2[0], c2[1])
.lineTo(c3[0], c3[1])
.closePath()
}
})
const colors = ['rgba(50, 197, 255, 0.8)', 'rgba(0, 253, 255, 0.8)', 'rgba(255, 235, 0, 0.8)']
const colorss = ['rgba(0, 145, 255, 1)', 'rgba(68, 215, 182, 1)', 'rgba(215, 170, 68, 1)']
// 注册三个面图形
echarts.graphic.registerShape('InclinedRoofBar', InclinedRoofBar)
const defaultOption = {
tooltip: {
show: true,
trigger: 'axis',
axisPointer: {
type: 'shadow'
}
},
grid: {
top: 10,
bottom: 30,
left: 10,
right: 10,
containLabel: true
},
yAxis: {
type: 'category',
data: [],
axisLine: {
show: false
},
axisTick: {
show: false
},
axisLabel: {
color(value, index) {
return colorss[index]
},
fontSize: 14
}
},
xAxis: {
type: 'value',
axisLine: {
show: false
},
min: 0,
splitLine: {
show: false
},
axisTick: {
show: false
},
axisLabel: {
show: false
},
boundaryGap: ['20%', '20%']
},
series: [
{
type: 'custom',
name: '',
itemStyle: {
color: 'rgba(44, 197, 253, 1)'
},
renderItem: (params, api) => {
const location = api.coord([api.value(0), api.value(1)])
const xlocation = api.coord([0, api.value(1)])
return {
type: 'InclinedRoofBar',
shape: {
api,
xValue: api.value(0),
yValue: api.value(1),
x: location[0],
y: location[1] + myShape.width,
xAxisPoint: [xlocation[0], xlocation[1] + myShape.width]
},
style: {
fill: new echarts.graphic.LinearGradient(0, 0, 1, 0, [
{
offset: 0,
color: colors[params.dataIndex]
},
{
offset: 1,
color: colorss[params.dataIndex]
}
])
}
}
},
data: []
},
{
type: 'bar',
label: {
normal: {
show: true,
position: 'right',
fontSize: 14,
offset: [15, 0]
}
},
showBackground: false,
barWidth: 14,
backgroundStyle: {
color: 'rgba(50, 197, 255, 0.1)'
},
itemStyle: {
color: 'transparent'
},
tooltip: {
show: false
},
data: []
}
]
}
export default {
data() {
return {
myChart: null
}
},
mounted() {
this.myChart = echarts.init(this.$refs.ConsumptionChart)
},
methods: {
getOption(seriesData) {
const option = defaultOption
const { yAxis, series } = option
// 处理数据
yAxis.data = ['低', '中', '高']
series[0].data = seriesData
series[1].data = seriesData.map((item, index) => Object.assign(item, { label: { color: colorss[index] } }))
this.myChart.setOption(option)
}
}
}
</script>
以上就是本文的全部内容,希望对大家的学习有所帮助,也希望大家多多支持。
以上是 vue实现横向斜切柱状图 的全部内容, 来源链接: utcz.com/p/239653.html