VUE和Antv G6实现在线拓扑图编辑操作
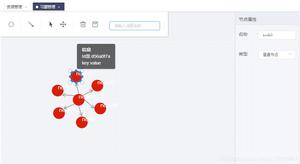
效果图如下:
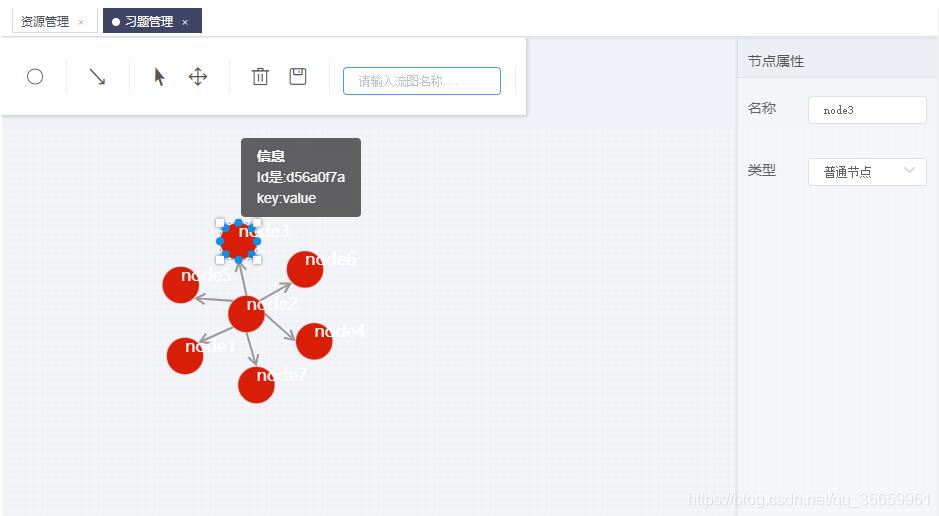
我使用的是G6 2.0,也可以使用 G6 3.0,3.0的拓扑图单独作为一个编辑器使用,使用更加方便。不过2.0的比较简单,容易上手。
1.首先在Antv官网上找到蚂蚁Antv G6插件,引入插件。
也可以npm 方式引入。
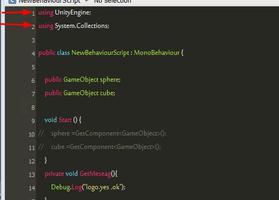
2.写组件
export default {
name: “index”,
components: {},
mounted() {
this.initG6();
},
data() {
return {
action: ‘',
name: ‘',
func: ‘',
account: ‘',
workflow: ‘',
nodeType: 0,
color: ‘',
net: ‘',
Util: ‘',
workflowName: ‘',
activation: ‘', //当前激活的节点
isNode: false, //当前是节点
isBlank: true, //当前是空白区
checked: true, //网格对齐
infoTitle: ‘画布',//属性标题
oldColor: ‘', //获取节点本身颜色
type: ‘', //有值为编辑状态
actionList:[],
nodeTypeList: [
{id: 0, label: ‘普通节点'}]
}
},
methods: {
initG6() {
let self = this;
self.Util = G6.Util;
let grid;
if (self.checked) {
grid = {
forceAlign: true, // 是否支持网格对齐
cell: 25, // 网格大小
};
} else {
grid = null;
}
// 生成度量
. . . . . .
// 工具方法
. . . . . .
var sourcesData={ }; //后台返回的数据
var trainScale = function(dim, scale){
var max = -Infinity;
var min = Infinity;
sourcesData.source.nodes.map(function(node){
max =30;
min =25;
});
scale.domain([min, max]);
};
var colors = ['#007AE7', ‘#40BCD2', ‘#81D6C3', ‘#C1E4BC', ‘#FFDD9B', ‘#FEAC4C', ‘#FF7C01', ‘#C4201D'];
. . . . . .
// 生成图
http://self.net = new http://G6.Net({
id: ‘knowledge', // 容器ID
height: canvasHeight, // 画布高
mode: ‘edit'
});
G6.Global.nodeLabelStyle = {
fill: ‘#fff',
textAlign: ‘left',
textBaseline: ‘bottom',
fontSize:24
};
self.net.tooltip(true);
self.net.node()
.size(function(model){
return sizeScale(model.weight)*2;
})
;
self.net.source(sourcesData.source.nodes, sourcesData.source.edges);
self.net.removeBehaviour([‘dragCanvas', ‘dragHideEdges', ‘dragHideTexts']);
self.net.addBehaviour([‘dragBlank']);
self.net.read(sourcesData);
self.net.render();
self.net.zoomAt(graphCenterX, graphCenterY, 0.7);
// 生成布局
var layoutNodes = sourcesData.source.nodes;
var layoutEdges = Util.clone(sourcesData.source.edges);
var ticked = function(){
self.net.updateNodesPosition();
};
…
/**
点击空白处
/
self.net.on(‘click', (ev) => {
if (!self.Util.isNull(ev.item)) {
self.isBlank = false
} else {
self.isBlank = true;
self.infoTitle = ‘画布'
}
});
/
点击节点
/
self.net.on(‘itemclick', function (ev) {
self.isNode = self.Util.isNode(ev.item); //是否为Node
self.activation = ev.item;
if (self.isNode) {
/ 激活节点后节点名称input聚焦/
self.KaTeX parse error: Expected '}', got 'EOF' at end of input: …ick(()=>{ self.refs.inputFocus.$el.querySelector(‘input').focus();
});
self.infoTitle = ‘节点';
self.name = ev.item.get(‘model').label;
self.func = ev.item.get(‘model').func;
self.account = ev.item.get(‘model').account || [];
self.workflow = ev.item.get(‘model').workflow;
} else {
self.infoTitle = ‘边';
self.action = ev.item.get(‘model').action;
}
self.color = self.oldColor;
});
/**
鼠标移入移出事件改变颜色
/
self.net.on(‘itemmouseenter', ev => {
const item = ev.item;
self.oldColor = item.get(‘model').color; //获取节点颜色
self.net.update(item, {
color: ‘#108EE9',
});
self.net.refresh();
});
self.net.on(‘itemmouseleave', ev => {
const item = ev.item;
self.net.update(item, {
color: self.oldColor
});
self.net.refresh();
});
/*
提示信息
*/
self.net.tooltip({
title: ‘信息', // @type {String} 标题
split: ‘:', // @type {String} 分割符号
dx: 0, // @type {Number} 水平偏移
dy: 0 // @type {Number} 竖直偏移
});
self.net.edge().tooltip() .size(‘val', function(val){
return 3;
});
/**
渲染
*/
/self.net.source(self.nodes, self.edges);/ //加载资源数据
// self.net.render();
},
addCircle() {
},//添加起始节点
addRect() {
},//添加常规节点
addRhombus() {
}, //添加条件节点
addLine() {
}, //添加直线
addSmooth() {
}, //添加曲线
addArrowSmooth() {
}, //添加箭头曲线
addArrowLine() {
}, //添加箭头直线
addPolyLine() {
}, //添加折线
changeMode(mode) {
}, //拖拽与编辑模式的切换
del() {
this.net.del()
},//删除
save() {
/* 验证流图名称*/
if (this.workflowName !== ‘') {
let data = this.net.save();
if (data.source.nodes.length === 0) {
this.KaTeX parse error: Expected 'EOF', got '}' at position 61: …; return false }̲ /* 验证节点名称*/ fo…message({type: ‘error', message: ‘节点名称不能为空'});
return false
}
}
data.source[‘name'] = this.workflowName;
/let json = JSON.stringify(data, null, 2);/
this.KaTeX parse error: Expected 'EOF', got '}' at position 43: …e, this.type); }̲ else { this.message({type: ‘error', message: ‘拓扑名称不能为空'})
}
/console.log(saveData, json);/
},//保存
update() {
}, //更新节点
clearView() {
this.type = ‘';
this.workflowName = ‘';
this.net.changeData()
}, //清空视图
source(nodes, edges, name, type) {
this.type = type;
this.workflowName = name;
this.net.changeData(nodes, edges)
}, //更新数据
},
watch: {
/**
监听输入框
/
action: function () {
this.update()
},
name: function () {
this.update()
},
func: function () {
this.update()
},
account: function () {
this.update()
},
workflow: function () {
this.update()
},
nodeType: function () {
this.update()
},
color: function () {
this.update()
},
/*
网格切换
*/
checked: function () {
let _saveData = this.net.save();
this.net.destroy(); //销毁画布
this.initG6();
this.net.read(_saveData);
this.net.render()
}
}
}
3.注意:
在实现过程中,我采用了度量的生成方法使节点均匀分布,否则需要指定节点的位置。不指定位置页面不会显示任何东西。
补充知识:antv G6关系树,拓扑图 不同层级不同颜色
前端菜鸡… 近期遇到一个需求,要求关系图每个层级不同颜色展示,位置还得随机,目前echart实现后都不太满意…em 于是G6 …
废话不多说 看代码(效果)//
1、引入G6 相关 (基础数据是官方的)
import G6 from '@antv/g6'
fetch('https://gw.alipayobjects.com/os/antvdemo/assets/data/algorithm-category.json')
.then(res => res.json())
.then(data => {
console.log(data)
const width = document.getElementById('map').scrollWidth;
const height = document.getElementById('map').scrollHeight || 500;
const graph= new G6.TreeGraph({
container: 'map',
width,
height,
pixelRatio: 2,
modes: {
default: [{
type: 'collapse-expand',
onChange: function onChange(item, collapsed) {
console.log(item)
const data = item.get('model').data;
data.collapsed = collapsed;
return true;
}
}, 'drag-canvas', 'zoom-canvas']
},
defaultNode: {
size: [200, 50],
shape: 'rect',
style: {
fill: '#C6E5FF',
stroke: '#5B8FF9'
}
},
defaultEdge: {
shape: 'cubic-horizontal',
style: {
stroke: '#A3B1BF'
}
},
layout: {
type: 'mindmap',
direction: 'H',
getHeight: () => {
return 40;
},
getWidth: () => {
return 160;
},
getVGap: () => {
return 10;
},
getHGap: () => {
return 100;
}
}
});
let centerX = 0;
// 以下重点
graph.node(function (node) {
// depth 类似节点标识
if(node.depth == 0){
console.log(node)
return {
size:[100,60],
style:{
fill:'red',
// stroke:''
},
label:node.id
}
}
if(node.depth == 1){
console.log(node)
return {
size:[100,60],
style:{
fill:'blue',
},
label:node.id
}
}
return {
label: node.id, // 设置显示名称
labelCfg: {
// position: node.children && node.children.length > 0 ? 'left' : node.x > centerX ? 'right' : 'left', // 设置显示左右
offset: 5
}
};
});
graph.data(data);
graph.render();
graph.fitView();
});
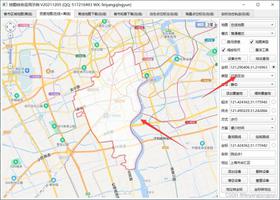
这样效果就出来了. 不同级不同颜色 看图

以上这篇VUE和Antv G6实现在线拓扑图编辑操作就是小编分享给大家的全部内容了,希望能给大家一个参考,也希望大家多多支持。
以上是 VUE和Antv G6实现在线拓扑图编辑操作 的全部内容, 来源链接: utcz.com/p/238317.html