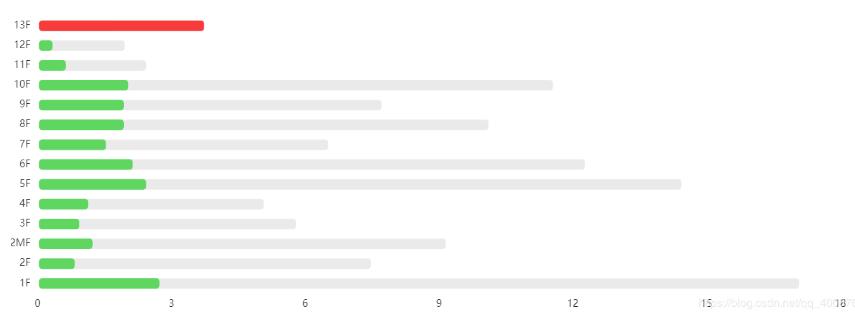
解决echarts 一条柱状图显示两个值,类似进度条的问题
我就废话不多说说了,大家还是直接看代码吧~
var allUseDayChartTwo;
function allUseDayChartTwoFun(obj,xdata,ydata,zdata){
allUseDayChartTwo = echarts.init(obj);
var category = xdata;
var lineData = zdata;
var barData = ydata;
option = {
// backgroundColor:'#F00',
tooltip: {
trigger: 'axis',
backgroundColor:'rgba(0,0,0,.5)',
axisPointer: {
type: 'shadow',
label: {
show: true,
backgroundColor: '#F1F1F1',
color:'#5A5A5A'
}
},
confine: true
},
grid: {
left: '1%',
right: '3%',
bottom: '5%',
top: '5%',
containLabel: true
},
xAxis: {
axisLine: {
lineStyle: {
color: '#B4B4B4'
}
},
axisTick:{
show:false,
},
axisLine:{
show:false
},
axisTick:{
show:false
},
splitLine:{
show:false
},
axisLabel:{
textStyle: {
fontSize: 14,
},
formatter:'{value} ',
},
},
yAxis: [{
data: category,
splitLine: {show: false},
axisLine: {
lineStyle: {
color: '#B4B4B4',
}
},
axisLabel:{
textStyle: {
fontSize: 14,
// color: '#B2B2B2'
},
formatter:'{value} ',
},
axisLine:{
show:false
},
axisTick:{
show:false
},
splitLine:{
show:false
}
}
// ,{
// data: category,
// splitLine: {show: false},
// axisLine: {
// lineStyle: {
// color: '#B4B4B4',
// }
// },
// axisLabel:{
// formatter:'{value} ',
// }
// }
],
series: [{
name: '用量',
type: 'bar',
barWidth: 15,
barGap: '-100%',
itemStyle: {
normal: {
barBorderRadius: 5,
color: new echarts.graphic.LinearGradient(
0, 0, 0, 1,
[
{offset: 0, color: 'rgba(88,228,88,0.8)'},
{offset: 1, color: 'rgba(88,228,88,0.8)'}
]
)
}
},
data: barData
},{
name: '阈值',
type: 'bar',
barGap: '-100%',
barWidth: 15,
itemStyle: {
normal: {
barBorderRadius: 5,
color: new echarts.graphic.LinearGradient(
0, 0, 0, 1,
[
{offset: 0, color: 'rgba(234,234,234,0.8)'},
{offset: 0.2, color: 'rgba(234,234,234,1)'},
{offset: 1, color: 'rgba(234,234,234,1)'}
]
)
}
},
z: -12,
data: lineData
}
// ,{
// name: '背景',
// type: 'bar',
// barGap: '-100%',
// barWidth: 15,
// itemStyle: {
// normal: {
// barBorderRadius: 5,
// color: new echarts.graphic.LinearGradient(
// 0, 0, 0, 1,
// [
// {offset: 0, color: 'rgba(0,0,0,0.2)'},
// {offset: 0.2, color: 'rgba(0,0,0,0.)'},
// {offset: 1, color: 'rgba(0,0,0,0.24)'}
// ]
// )
// }
// },
// z: -20,
// data: [50,50,50,50,50,50,50,50,50]
// }
]
};
allUseDayChartTwo.setOption(option);
}
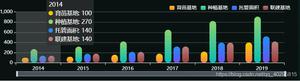
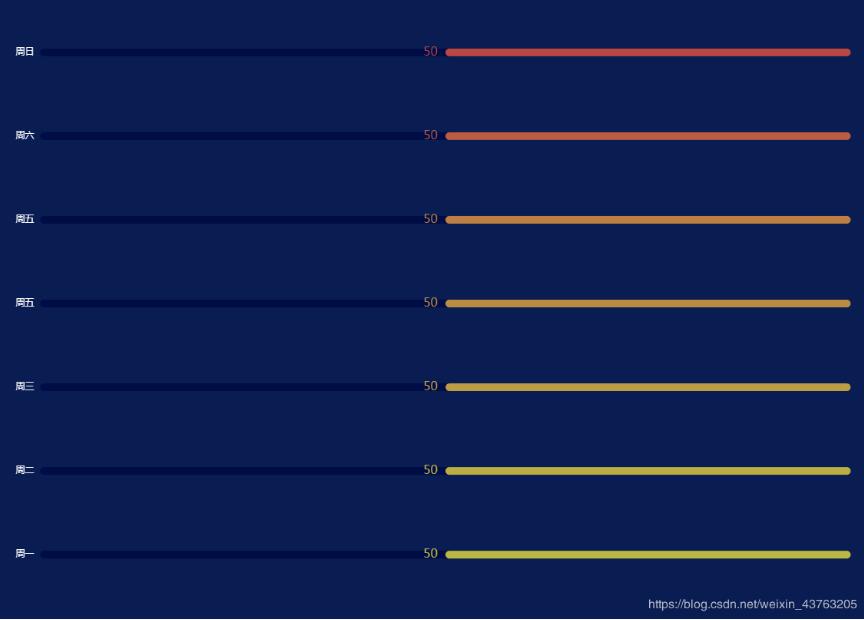
补充知识:echarts 柱状图实现进度条,进行数据驱动
echarts 柱状图实现进度条,进行数据驱动
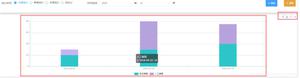
效果图
直接写上配置项,根据自己的需求更改
option = {
backgroundColor: '#0a1d53',
grid: {
left: '2%',
top: '2%',
right: '2%',
bottom: '2%',
containLabel: true
},
tooltip: {
trigger: 'item',
axisPointer: {
// 坐标轴指示器,坐标轴触发有效
type: 'shadow' // 默认为直线,可选为:'line' | 'shadow'
}
},
textStyle: {
color: '#fff'
},
xAxis: {
show: false,
type: 'value',
// 设置x轴显示几段
min: 0,
max: 100,
inverse: true,
splitLine: {
show: false
},
interval: 50
},
yAxis: {
show: true,
type: 'category',
data: [
'周一',
'周二',
'周三',
'周五',
'周五',
'周六',
'周日'
],
axisTick: { show: false },
axisLine: {
show: false,
lineStyle: {
color: 'red'
}
},
splitLine: {
show: false
},
inside: true,
textStyle: {
color: '#000c45'
}
},
series: [
{
type: 'bar',
itemStyle: {
normal: {
color: '#000c45', // 定义柱形的背景色
barBorderRadius: [5, 5, 5, 5] // 定义背景柱形的圆角
}
},
barGap: '-100%', // 设置柱形重合的重要步骤
data: [100, 100, 100, 100, 100, 100, 100],
z: 0,
silent: true,
animation: false, // 关闭动画效果
barWidth: '10px' // 设置柱形宽度
},
{
type: 'bar',
data: [50, 50, 50, 50, 50,50, 50],
barWidth: '10px',
barGap: '-100%', // 设置柱形重合的重要步骤
label: {
normal: {
show: true, //是否显现,不显示的话设置成false
position: "left", //显示的位置
distance: 10, //距离侄子的值 // label要显示的值比如: 20%
formatter: function(param) {
return param.value;
},
textStyle: {
//这个地方颜色是支持回调函数的这种的,如果是一种颜色则可以写成: color :'#1089E7'
color: function(params) {
var num = myColor.length; //得到myColor颜色数组的长度
return myColor[params.dataIndex % num]; //返回颜色数组中的一个对应的颜色值
},
fontSize: "16"
}
}
},
itemStyle: {
normal: {
color: function (params) {
var colorList = [
'#bbb743',
'#bbae43',
'#bb9d43',
'#bb8c43',
'#bb7e43',
'#bb5c43',
'#bb4643'
]
return colorList[params.dataIndex]
},
barBorderRadius: [5, 5, 5, 5] // 定义柱形的圆角
}
}
}
]
}
以上这篇解决echarts 一条柱状图显示两个值,类似进度条的问题就是小编分享给大家的全部内容了,希望能给大家一个参考,也希望大家多多支持。
以上是 解决echarts 一条柱状图显示两个值,类似进度条的问题 的全部内容, 来源链接: utcz.com/p/237551.html