在vue中使用Echarts利用watch做动态数据渲染操作
依旧直接上代码~
首先安装引入Echarts,我是直接把Echarts挂到VUE全局变量上了
//引入echarts
import Vue from 'vue';
import echarts from 'echarts';
Vue.prototype.$echarts = echarts;
<template>
<div class="demo-container">
<div ref="chart_wrap" class="chart_wrap"></div>
</div>
</template>
<script>
export default {
name: "demo",
computed: {},
data() {
return {
seriesData: []
};
},
created() {},
mounted() {
this.initCharts();
setTimeout(() => {
this.seriesData.push({
name: "销量",
type: "bar",
data: [5, 20, 36, 10, 10, 20]
});
}, 5000);
},
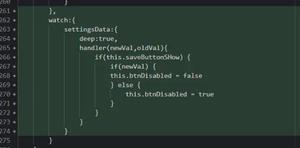
watch: {
seriesData(val, oldVal) {
console.log(1111, val, oldVal);
this.setOptions(val);
}
},
methods: {
initCharts() {
this.chart = this.$echarts.init(this.$refs.chart_wrap);
this.setOptions();
},
setOptions(series) {
console.log(22222,this.chart,series);
this.chart.setOption({
title: {
text: "ECharts 入门示例"
},
tooltip: {},
legend: {
data: ["销量"]
},
xAxis: {
data: ["衬衫", "羊毛衫", "雪纺衫", "裤子", "高跟鞋", "袜子"]
},
yAxis: {},
series: series
});
}
}
};
</script>
<style rel="stylesheet/scss" lang="scss" scoped>
.chart_wrap {
height: 400px;
}
</style>
补充知识:echarts-循环生成图
1、问题背景
利用for循环生产多个气泡图,并且每个气泡都可以点击
2、实现源码
<!DOCTYPE html>
<html>
<head>
<meta charset="UTF-8">
<title>echarts-循环生成图</title>
<link rel="shortcut icon" href="../js/echarts-2.2.7/doc/asset/ico/favicon.png">
<script type="text/javascript" src="../js/echarts-2.2.7/doc/asset/js/jquery.min.js" ></script>
<script type="text/javascript" src="../js/echarts-2.2.7/doc/example/www2/js/echarts-all.js" ></script>
<style>
body,html,#div-chart{
width: 99%;
height: 100%;
font-family: "微软雅黑";
font-size: 12px;
}
.chart{
width: 1200px;
height: 100px;
}
</style>
<script>
$(document).ready(function(){
buildChart();
buildChartJS();
});
function buildChart()
{
$("#div-chart").empty();
var chart = "";
for(var i=0;i<8;i++)
{
chart += "<div id='chart"+i+"' class='chart'></div>";
}
$("#div-chart").append(chart);
}
function buildChartJS()
{
for(var i=0;i<8;i++)
{
var chart = document.getElementById('chart'+i);
var echart = echarts.init(chart);
var option = {
legend: {
data:['scatter1'],
show:false
},
splitLine:{
show:false
},
grid:{
borderWidth:0
},
xAxis : [
{
show:false,
type : 'value',
splitNumber: 2,
scale: true,
axisLine:{
show:false
},
splitLine:{
show:false
},
axisTick:{
show:false
}
}
],
yAxis : [
{
show:false,
type : 'value',
splitNumber: 2,
scale: true,
axisLine:{
show:false
},
splitLine:{
show:false
}
}
],
series : [
{
name:'scatter1',
type:'scatter',
symbol: 'emptyCircle',
symbolSize: 20,
itemStyle : {
normal: {
color:'#0068B7',
label:{
show: true,
position: 'inside',
textStyle : {
fontSize : 26,
fontFamily : '微软雅黑',
color:'#0068B7'
}
}
}
},
data: randomDataArray()
}
]
};
function eConsole(param)
{
alert(param.value);
console.dir(param);
}
echart.on("click", eConsole);
echart.setOption(option);
}
}
function randomDataArray()
{
var d = [];
var arr = [3,5,7,9,10,1,2,4,8,6];
var len = 10;
for(var i=0;i<len;i++)
{
d.push([i+1,0,arr[i],]);
}
return d;
}
</script>
</head>
<body>
<div id="div-chart">
</div>
</body>
</html>
3、实现结果

以上这篇在vue中使用Echarts利用watch做动态数据渲染操作就是小编分享给大家的全部内容了,希望能给大家一个参考,也希望大家多多支持。
以上是 在vue中使用Echarts利用watch做动态数据渲染操作 的全部内容, 来源链接: utcz.com/p/237534.html