canvas怎么画出圆环+数字效果?
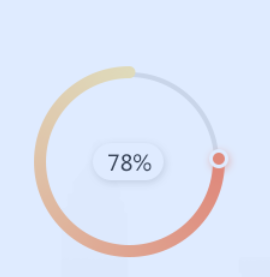
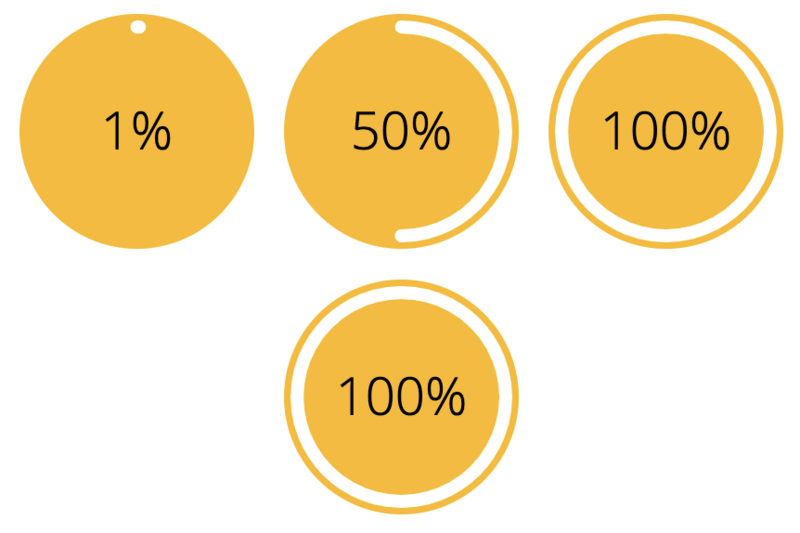
请问CSS大佬们,这个圆环怎么实现(主要是圆环头部那个点。。)
回答
<canvas id="toturial" height="200"></canvas>var ctx = document.getElementById('toturial').getContext('2d')
//背景圈
ctx.beginPath()
ctx.strokeStyle = '#eaf0f9'
ctx.lineWidth = 20
ctx.arc(100,100,80,0,2*Math.PI)
ctx.stroke()
ctx.closePath()
//蓝色圈
ctx.beginPath()
var lingrad = ctx.createLinearGradient(50,30,100,50);//颜色渐变
lingrad.addColorStop(0, '#61aef9');
lingrad.addColorStop(0.5, '#4e95f5');
lingrad.addColorStop(0.5, '#498ef5');
lingrad.addColorStop(1, '#3e75f6');
ctx.strokeStyle = lingrad
ctx.lineWidth = 20
ctx.lineCap = 'round'
ctx.arc(100,100,80,-0.5 * Math.PI,1.35 * Math.PI)
ctx.stroke()
ctx.closePath()
//小白点
ctx.beginPath()
ctx.fillStyle = '#fff'
ctx.arc(60,30,6,0,2*Math.PI)
ctx.fill()
ctx.closePath()
颜色渐变不好处理,白色点是试出来的!仅供参考
canvas就行分成四部分:
1.底层圆环;
2.上层圆环;
3.小圆;
4.文字部分;
画圆环比较容易,百度上多的是,小白圆也好画,主要是位置需要计算,根据进度,线宽,小圆自身尺寸,确定坐标,需要精确计算,多试试,也不难。
我这儿正好有个一模一样的东西。你拿去参考。代码时vue组件,内容多一些,思路就是上面这个思路。

<!-- canvas环形进度条;--><template>
<div>
<canvas :id='id' :style='canvasStyle' class="canvas" height="400" width="400"></canvas>
</div>
</template>
<script>
export default {
name: "vbAnnularProgress",
props: {
canvasStyle: {
type: Object,
default: {
width: '200px',
height: '200px'
}
},
gradation: {//渐变色
type: Array,
default() {
return []
}
},
anti: {
type: Boolean,
default: false
},
fontShow: {
type: Boolean,
default: false
},
height: {
type: Number,
default: 15
},
bgColor: {//底环颜色
type: String,
default: '#eee'
},
topColor: {//顶环颜色
type: String,
default: 'green'
},
percentage: {
type: Number,
default: 75
},
endcircle: { //结束时候是否显示原点
type: Boolean,
default: false
},
fontStyle: {//文字大小,颜色
type: Object,
default(){
return{
fontSize: 30,
color: '#000'
}
}
}
},
data: function () {
return {
ctx: '',
circ: Math.PI * 2,//360度
quart: Math.PI / 2,// 90度
id: 'canvas_' + Math.floor(Math.random() * 100000),
timer: null,
}
},
mounted() {
this.canvasInit();
['height', 'bgColor', 'topColor', 'percentage', 'fontStyle'].forEach(val => {
this.$watch(val, {
handler() {
this.canvasInit();
},
deep: true
})
})
},
methods: {
canvasInit() {//初始化
var canvas_ = document.getElementById(this.id);
var ctx = this.ctx = canvas_.getContext('2d');
ctx.clearRect(0, 0, canvas_.width, canvas_.height);
ctx.lineCap = 'round';
ctx.lineWidth = this.height;
this.initBackCircle();
this.initTopCircle();
this.initFont();
},
initBackCircle() {// 底圆描绘
var ctx = this.ctx;
ctx.beginPath();
ctx.strokeStyle = this.bgColor;
ctx.arc(200, 200, 170, -(this.quart), 2 * Math.PI);
ctx.stroke();
},
initTopCircle() {//顶圆描绘
var ctx = this.ctx;
var _this = this;
if (this.gradation.length > 0) {
var g;
if (_this.anti) {//true逆时针。 false顺时针
g = ctx.createLinearGradient(200, 0, 200, 400); //创建渐变对象 渐变开始点和渐变结束点
} else {
g = ctx.createLinearGradient(200, 0, 200, 400); //创建渐变对象 渐变开始点和渐变结束点
}
g.addColorStop(0, this.gradation[0], '100%', '50%'); //添加颜色点
g.addColorStop(1, this.gradation[1]); //添加颜色点
ctx.strokeStyle = g; //使用渐变对象作为圆环的颜色
} else {
ctx.strokeStyle = this.topColor;
}
function draw(current) {
if(current <= 0){return}
ctx.beginPath();
if (_this.anti) {//true逆时针。 false顺时针
ctx.arc(200, 200, 170, -(_this.quart), - _this.quart - ((_this.circ) * current), _this.anti);
} else {
ctx.arc(200, 200, 170, -(_this.quart), ((_this.circ) * current) - _this.quart, _this.anti);
}
ctx.stroke();
}
var t = 0;
_this.timer = null;
function loadCanvas(now) {
_this.timer = setInterval(function () {
if (t > now) {
ctx.shadowBlur=10;
ctx.shadowColor=ctx.strokeStyle;
draw(now);//最后一次绘制
clearInterval(_this.timer);
_this.timer = null;
if (_this.endcircle) {
_this.initEndCircle();
}
} else {
draw(t);
t += 0.01;
}
}, 20);
}
loadCanvas(this.percentage / 100);
},
initEndCircle() {
var img = new Image();
var ctx = this.ctx;
let x = 0;
if (this.percentage < 50) {
x = 200 - 170 * Math.sin((100 - this.percentage / 100) * 2 * Math.PI);
}
else {
x = 200 + 170 * Math.sin(this.percentage / 100 * 2 * Math.PI);
}
let y = 200 - 170 * Math.cos(this.percentage / 100 * 2 * Math.PI);
// ctx.drawImage(img, 20, 20, x, y);
// img.onload = function () {
// // 将图片画到canvas上面上去!
// ctx.drawImage(img, x, y, 62, 62);
// }
// img.src = require("../../../../assets/images/studyCenter/ls_radius.png");
ctx.beginPath();
ctx.arc(x, y, 5, 0, 2 * Math.PI);
ctx.fillStyle = "#fff";
ctx.closePath();
ctx.fill();
},
initFont() {//文字描绘
if (!this.fontShow) { return }
var ctx = this.ctx;
ctx.font = this.fontStyle.fontSize + " Arial";
ctx.fillStyle = this.fontStyle.color;
ctx.textAlign = 'center';
ctx.fillText(this.percentage + "%", 200, 200);
},
}
};
</script>
<style lang="less" scoped>
.canvas {
height: 100%;
width: 100%;
min-width: 50px;
min-height: 50px;
}
</style>

https://codepen.io/web-tiki/d...
以上是 canvas怎么画出圆环+数字效果? 的全部内容, 来源链接: utcz.com/a/21066.html


