SpringBootActuator详解

执行器(Actuator)是一个制造业术语,指的是用于移动或控制东西的一个机械装置,一个很小的改变就能让执行器产生大量的运动。
前言
在当下流行的Service Mesh架构中,由于Spring boot框架的种种优点,它特别适合作为其中的应用开发框架。
Service Mesh的微服务架构,主要特点是将服务开发和服务治理分离开来,然后再结合容器化的Paas平台,将它们融合起来,这依赖的都是互相之间默契的配合。也就是说各自都暴露出标准的接口,可以通过这些接口互相交织在一起。
由于微服务之后,系统结构拆分随着业务发展越来越微型化,也意味着节点会呈现几何数量级增长。每个一个节点都是系统组成部分,如何保持如此多节点的可用性是一件非常有挑战的工作。全方位的监控变得越来越重要,当我们遇到bug时,总是希望可以看到更多信息,因此一般我们选用的服务开发框架都需要有方便又强大的监控功能支持。
Spring Boot Actuator便可以帮助我们全方面监控应用节点,比如健康检查、审计、统计、HTTP追踪等。我们可以通过JMX或者HTTP endpoints来获得。spring Boot Admin配合下可以进行页面展示,也和可以与其它外部应用系统系统整合。。
Actuator的使用方法
在Spring Boot应用中,要实现监控的功能,只需要依赖组件spring-boot-starter-actuator。它提供了很多监控和管理你的spring boot应用的HTTP或者JMX端点,并且你可以有选择地开启和关闭部分功能。当你的spring boot应用中引入依赖之后,将自动拥有审计、健康检查、Metrics监控功能。如下,组件依赖:
<dependency><groupId>org.springframework.boot</groupId>
<artifactId>spring-boot-starter-actuator</artifactId>
</dependency>
在引入上述的组件jar之后,我们先看看actuator提供了哪些接口,这些接口提供了什么功能?
ednpoints
在应用启动之后,我们首先访问/actuator,如下所示:
actuator接口.png
- /actuator:接口展示,显示actuator提供的访问接口,上图显示的是3个,不过这只是默认显示,我们可以进行配置管理。
- /actuator/health:健康检查,显示应用健康信息
- /actuator/info:应用信息,展示了关于应用的一般信息,这些信息从编译文件比如META-INF/build-info.properties或者Git文件比如git.properties或者任何环境的property中获取。
我们先看一下健康检查接口,访问http://localhost:8888/actuator/health,如下所示:
health接口.png
status值为UP说明应用是健康的,如果应用不健康,将会显示DOWN。
默认情况下,只有 health 和 info 通过 HTTP 暴露出来,所以 /actuator 只展示了 health 和 info endpoints。如何暴露其他的 endpoints ?首先,让我们先了解一下其他的endpoints。我们可以在《endpoints官网说明》 查看完整的列表,下面介绍一些常用的:
auditevent
显示应用暴露的审计事件(比如认证进入、订单失败)
info
显示应用的基本信息
health
显示应用的健康状态
metrics
显示应用多样的度量信息
loggers
显示和修改配置的loggers
logfile
返回log file中的内容(如果logging.file或者logging.path被设置)
httptrace
显示HTTP足迹,最近100个HTTP request/reponse
env
显示当前的环境特性
flyway
显示数据库迁移路径的详细信息
shutdown
优雅地逐步关闭应用
mappings
显示所有的@RequestMapping路径
scheduledtasks
显示应用中的调度任务
threaddump
执行一个线程dump
heapdump
返回一个GZip压缩的JVM堆dump
metrics
metrics endpoint展示了你可以追踪的度量,例如jvm内存、cpu使用、jvm线程等。如下所示:
metrics endpoint.png
如果想要查看单个度量的详细信息,我们需要度量名称传入到metrics request接口中,如下所示:
http://localhost:8080/actuator/metrics/{MetricName}比如我们想要查看system.cpu.count 度量,如下进行访问:
metrics度量查看.png
loggers
loggers endpoint 展示了应用中可配置的loggers列表和相关日志等级,我们可以访问接口http://localhost:8878/actuator/loggers,如下所示:
loggers日志等级查看.png
如果我们想要查看单个logger的日志配置信息,可以访问如下格式的:
http://localhost:8878/actuator/loggers/{name}例如,我们想要查看com.netflix的日志级别信息,如下所示:
discoveryclient logger.png
loggers endpoint 同时提供了在应用运行时改变日志级别的能力,比如你想要改变com.netflix.discovery.DiscoveryClient的logger等级为DEBUG,可以发送一个POST请求,如下所示:
POST http://localhost:8878/actuator/loggers/com.chandlerContent-Type application/json; charset=UTF-8
日志级别修改.png
loggers日志级别修改结果.png
动态修改日志级别的功能对于日常排查问题,是一个有利支持。同时可以传递null給configuredLevel来重置日志等级。
endpoint控制
默认情况,上述所有的endpints都是打开多,除了shutdown endpoint。如果我们想要控制单个endpoint 开关,可以进行如下配置:
management.endpoint.<id>.enabled=true/false例如,想要打开shutdown endpint,可以在application.properties文件中进行如下配置:
management.endpoint.shutdown.enabled=true参数配置
刚刚介绍了如何通过配置来对endpoint开关的控制,Actuator为我们提供丰富的参数配置。接下来我将和大家一起去认识,掌握一些常用的配置。
显示详细的监控信息
health endpoint 只展示了简单的UP和DOWN状态,为了获得健康检查中所有指标的详细信息,我们可以在application.properties中增加如下配置:
management.endpoint.health.show-details=always配置之后,我们再次访问http://localhost:8888/actuator/health,获取信息如下:
{"status":"UP",
"details":{
"diskSpace":{
"status":"UP",
"details":{
"total":249788112896,
"free":80719609856,
"threshold":10485760
}
},
"refreshScope":{
"status":"UP"
},
"discoveryComposite":{
"status":"UP",
"details":{
"discoveryClient":{
"status":"UP",
"details":{
"services":[
"service-instance-peer"
]
}
},
"eureka":{
"description":"Remote status from Eureka server",
"status":"UNKNOWN",
"details":{
"applications":{
"SERVICE-INSTANCE-PEER":1
}
}
}
}
},
"hystrix":{
"status":"UP"
}
}
}
从上面的应用的详细健康信息发现,包含了磁盘空间、熔断器hystrix、刷新refreshScope、服务注册中心。说明spring boot应用连接注册中心,并开启了刷新功能,熔断器功能,而actuator自动将这些监控了起来。
management.endpoint.health.show-details的默认值为never,除了always之外还有when-authorized。
健康指标
Abstracthealthindicator的子类
从抽象类AbstractHealthIndicator可以看出,actuator原生封装了很多的健康指标,例如ElasticsearchHealthIndicator、DataSourceHealthIndicator、RedisHealthIndicator、RabbitHealthIndicator等。这就意味着当我们使用
Elasticsearch、DataSource、Redis等资源的时候,会自动增加健康指标。不过我们有时候希望留下一些我们想要关注等健康指标,而过滤掉一些指标。
actuator提供了关闭健康指标的功能,比如我们想要关闭 mongoDB 健康指标,可以在application.properties中添加如下配置:
management.health.mongo.enabled=false我对哪些可以关闭产生了好奇,所以深挖了源代码发现如下的逻辑:
HealthIndicatorNameFactory.png
HealthIndicatorNameFactory在管理健康指标开关的时候,将类名进行了截取做为key,如此我们可以在application.properties中管理如下的HealthIndicator:
健康指标开关
然而,我们可以发现actuator没有提供consul和eureka健康指标的管理。不过这样也说了,我们可以创建自定义的健康指标,只要我们实现了HealthIndicator接口,如下所示:
importorg.springframework.boot.actuate.health.Health;importorg.springframework.boot.actuate.health.HealthIndicator;
importorg.springframework.stereotype.Component;
@Component
publicclassMyHealthIndicatorimplementsHealthIndicator{
@Override
publicHealthhealth(){
int errorCode =check();// perform some specific health check
if(errorCode !=0){
returnHealth.down().withDetail("Error Code", errorCode).build();
}
returnHealth.up().build();
}
}
我们也可以通过继承抽象类AbstractHealthIndicator来实现自定义的健康指标,如下所示:
importorg.springframework.boot.actuate.health.AbstractHealthIndicator;importorg.springframework.boot.actuate.health.Health;
importorg.springframework.stereotype.Component;
/**
* 自定义健康指标
*
* @author 钱丁君-chandler 2019/5/11下午6:07
* @since 1.8
*/
@Component
publicclassCustomHealthIndicatorextendsAbstractHealthIndicator{
protectedvoiddoHealthCheck(Health.Builder builder)throwsException{
// Use the builder to build the health status details that should be reported.
// If you throw an exception, the status will be DOWN with the exception message.
builder.up()
.withDetail("app","Alive")
.withDetail("author","chandler");
}
}
重现启动spring boot应用,再次访问http://localhost:8888/actuator/health,如下所示:
自定义健康指标
应用信息
info endpoint 展示了应用的基本信息,它通过META-INF/build-info.properties来获取编译信息,通过git.properties来获取当前应用的Git版本信息。同时它可以展示任何信息,只要应用环境property中含有info key。
1.自定义信息
如果我们进行任何配置,info endpoint 展示信息为空,不过这也是一个很重要的端点。首先,我们尝试在application.properties中进行如下配置:
#info接口展示info.app.name=${spring.application.name}
info.app.description=@project.description@
info.app.version=@project.version@
info.app.encoding=@project.build.sourceEncoding@
info.app.java.version=@java.version@
如上所示,我们进行一些信息配置,包含应用名称、应用描述、应用版本、编码格式、JDK版本。当我们再次访问info endpoint 时,能够得到如下信息:
info endpoint
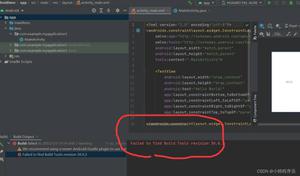
info显示异常
info显示异常
也许你会遇到如上所示的情况,这就说明没有从META-INF/build-info.properties读取到信息,你可以检查一下该文件。
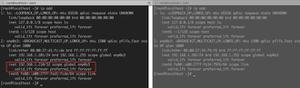
build-info.png
解决方法:使用spring boot插件构建一次。
spring boot build.png
2.git.properties
首先我们需要添加git-commit-id-plugin插件,该插件用来产生git的版本信息。如下所示:
<plugin><groupId>pl.project13.maven</groupId>
<artifactId>git-commit-id-plugin</artifactId>
</plugin>
完成了上述配置之后,执行git-commit-id-plugin插件。
git-commit-id-plugin
接下来,我们启动应用并访问端点http://localhost:8888/actuator/info,如下所示:
info端点结果
其中,包含了关于branch和commit的基础信息,如果我们想要获取更全面的git版本信息,可以在application.properties中进行如下配置:
management.info.git.mode=full
全面的git信息
endpoint暴露控制
前面所述,actuator提供了丰富的endpoint ,有部分是我们在意的,也会有我们不在意的。如你所愿,actuator提供了更加丰富的功能,请看如下配置信息:
management.endpoints.web.exposure.include=management.endpoints.web.exposure.exclude=
include表示需要暴露的endpoint,配置时使用“,”隔开,你也可以用*让所有endpoint暴露出来,如下所示:
management.endpoints.web.exposure.include=*management.endpoints.web.exposure.include=health,info
exclude表示在暴露endpoint时,排除掉哪些,同样使用“,”隔开,如下所示:
management.endpoints.web.exposure.exclude=infosecurity
actuator可以配合security进行权限控制,保护endpint。大家有兴趣可以自行探索,在此本人就不赘述了。
如果需要給我修改意见的发送邮箱:erghjmncq6643981@163.com
本博客的代码示例已上传GitHub:重新学习Spring Cloud组件https://github.com/erghjmncq6643981/cloud-2019
https://www.docs4dev.com/docs/zh/spring-boot/2.1.1.RELEASE/reference/production-ready-endpoints.html
以上是 SpringBootActuator详解 的全部内容, 来源链接: utcz.com/z/516269.html