关于echarts图表多个x轴和y轴的问题
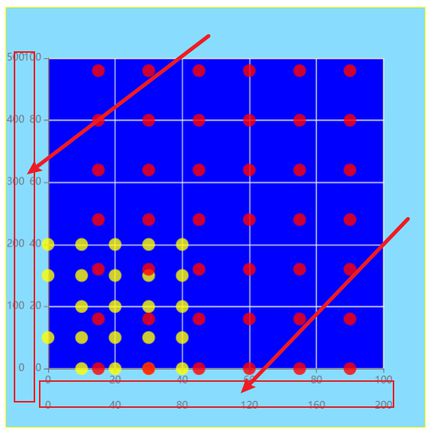
如图1所示,我想设置多个x轴,y轴显示,可是在把xAxis,yAxis设置成数组之后,只有刻度值,没有轴线
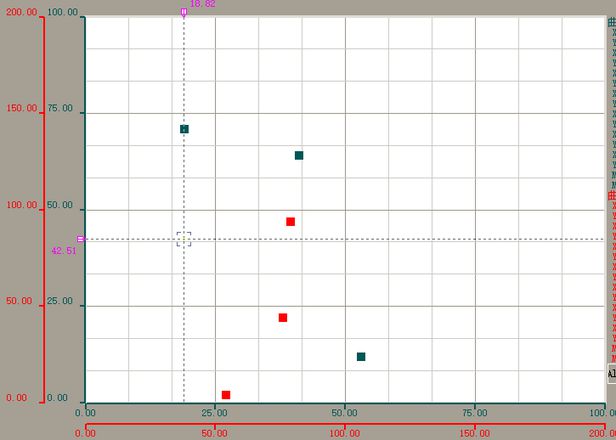
想要实现的效果如图2所示
下面是配置项:
this.option = { parallel: {},
// tooltip: {
// trigger: "axis",
// },
xAxis: [
{
interval: 20,
type: "value",
axisLabel: this.isPercentage
? {
show: true,
interval: "auto",
formatter: "{value} %",
}
: {},
show: this.isCoordinateAxis,
// axisPointer: "shadow",
max: 100,
min: 0,
},
{
interval: 200 / 5,
type: "value",
axisLabel: this.isPercentage
? {
show: true,
interval: "auto",
formatter: "{value} %",
}
: {},
show: this.isCoordinateAxis,
axisLine:{
show:true
},
position: "bottom",
offset: 30,
max: 200,
min: 0,
},
],
yAxis: [
{
interval: 20,
type: "value",
axisLabel: this.isPercentage
? {
show: true,
interval: "auto",
formatter: "{value} %",
}
: {},
show: this.isCoordinateAxis,
max: 100,
min: 0,
// position: "right",
},
{
interval: 500 / 5,
type: "value",
axisLabel: this.isPercentage
? {
show: true,
interval: "auto",
formatter: "{value} %",
}
: {},
show: this.isCoordinateAxis,
position: "left",
offset: 20,
max: 500,
min: 0,
// position: "right",
},
],
grid: {
show: true,
backgroundColor: this.EchartsBgColor,
// border: "5px solid red",
// y: 0,
// borderColor: "red",
// borderWidth: 1,
// },
// x: 110,
// y: 0,
},
series: [
{
symbolSize: 15,
xAxisIndex: 0,
yAxisIndex: 0,
data: [
[10, 0],
[10, 10],
[10, 20],
[10, 30],
[10, 40],
// [0, 0],
[0, 10],
// [0, 2],
[0, 30],
[0, 40],
[20, 0],
[20, 10],
[20, 20],
[20, 30],
[20, 40],
[30, 0],
[30, 10],
[30, 20],
[30, 30],
[30, 40],
[40, 0],
[40, 10],
[40, 20],
[40, 30],
[40, 40],
],
color: "yellow",
type: "scatter",
},
{
symbolSize: 15,
xAxisIndex: 1,
yAxisIndex: 1,
data: [
[30, 0],
[30, 80],
[30, 160],
[30, 240],
[30, 320],
[30, 400],
[30, 480],
[60, 0],
[60, 80],
[60, 160],
[60, 240],
[60, 320],
[60, 400],
[60, 480],
[90, 0],
[90, 80],
[90, 160],
[90, 240],
[90, 320],
[90, 400],
[90, 480],
[120, 0],
[120, 80],
[120, 160],
[120, 240],
[120, 320],
[120, 400],
[120, 480],
[150, 0],
[150, 80],
[150, 160],
[150, 240],
[150, 320],
[150, 400],
[150, 480],
[180, 0],
[180, 80],
[180, 160],
[180, 240],
[180, 320],
[180, 400],
[180, 480],
],
color: "red",
type: "scatter",
},
],
};
图1:
图2:
回答:
这个应该是由于x,y都设置了双轴的原因。
一边单轴一边双轴echarts本身能区分开来的,都双轴的话,就是有二个轴但是他们重叠了,需要通过axisLine.onZero = false将重叠的轴区分来。
option = { xAxis: [{
type: "value",
max: 100,
min: 0,
axisLine: {
lineStyle: {
color: "blue"
}
}
},
{
type: "value",
max: 100,
min: 0,
position: "bottom",
offset: 30,
axisLine: {
lineStyle: {
color: "red"
},
onZero:false
}
}
],
yAxis: [
{
type: "value",
max: 100,
min: 0,
axisLine: {
lineStyle: {
color: "blue"
}
}
},
{
type: "value",
position: "left",
offset: 30,
max: 500,
min: 0,
axisLine: {
lineStyle: {
color: "red"
},
onZero:false
}
},
],
};
以上是 关于echarts图表多个x轴和y轴的问题 的全部内容, 来源链接: utcz.com/p/936867.html


