求解:接完接口后echarts饼图和线图这种联动和共享数据集的图中饼图必须鼠标滑过或者点击才会出现?
刚进页面的样子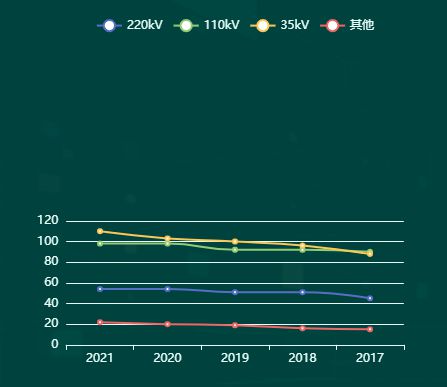
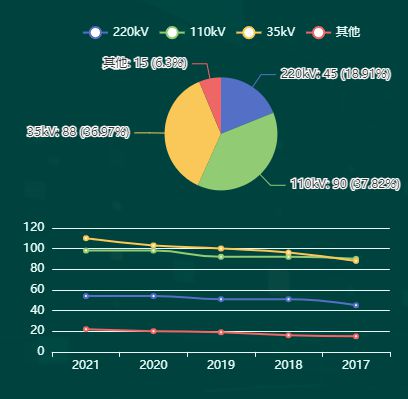
鼠标滑过这两块,饼图才会出现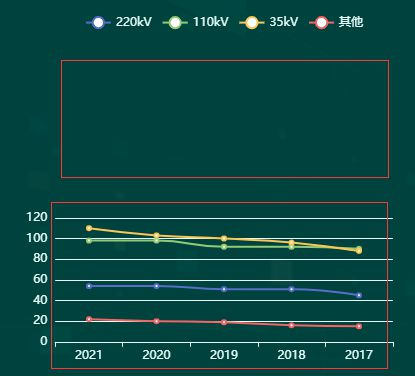
父组件
<ShareDataset :chartId="'chartId1'" :chartData="chartData1"></ShareDataset>子组件
<div class="charts"> <div :id="chartId" :style="{ height: height, width: width }"></div>
</div>
<script>
import * as echarts from "echarts"
import { onMounted, computed, toRefs, watch } from "vue"
export default {
props: {
chartId: {
type: String,
default: () => {
return "chartId"
}
},
chartData: {
type: Array
},
height: {
type: String,
default: "100%"
},
width: {
type: String,
default: "100%"
}
},
setup(props) {
const { chartData, chartId } = toRefs(props)
const setOptions = computed(() => {
let option = {
legend: {
textStyle: {
fontSize: 12,
color: "#e8fffb"
}
},
tooltip: {
trigger: "axis",
showContent: false
},
dataset: {
source: props.chartData
// source: [
// ["product", "2012", "2013", "2014", "2015", "2016", "2017"], // 线图x轴下标名
// ["220kV", 56.5, 82.1, 88.7, 70.1, 53.4, 85.1],
// ["110kV", 51.1, 51.4, 55.1, 53.3, 73.8, 68.7],
// ["35kV", 40.1, 62.2, 69.5, 36.4, 45.2, 32.5],
// ["其它", 25.2, 37.1, 41.2, 18, 33.9, 49.1]
// ]
},
xAxis: {
type: "category",
axisLine: {
lineStyle: {
color: "#e8fffb"
// width: 1 //这里是为了突出显示加上的
}
}
},
yAxis: {
gridIndex: 0,
splitLine: {
lineStyle: {
// 使用深浅的间隔色
color: ["#e8fffb"]
}
},
nameTextStyle: {
color: ["#e8fffb"]
},
axisLine: {
lineStyle: {
color: "#e8fffb",
width: 1 //这里是为了突出显示加上的
}
}
},
grid: { top: "55%", bottom: "12%" },
series: [
{
type: "line",
smooth: true,
seriesLayoutBy: "row",
emphasis: { focus: "series" }
},
{
type: "line",
smooth: true,
seriesLayoutBy: "row",
emphasis: { focus: "series" }
},
{
type: "line",
smooth: true,
seriesLayoutBy: "row",
emphasis: { focus: "series" }
},
{
type: "line",
smooth: true,
seriesLayoutBy: "row",
emphasis: { focus: "series" }
},
{
type: "pie",
id: "pie",
radius: "30%",
center: ["50%", "30%"],
emphasis: {
focus: "self"
},
label: {
formatter: "{b}: {@2012} ({d}%)"
},
encode: {
itemName: "product",
// value: "2012",
// tooltip: "2012"
}
}
]
}
return option
})
// 创建图表
function initChart() {
echarts.init(document.getElementById(props.chartId)).dispose() // 销毁实例
let myChart = echarts.init(document.getElementById(props.chartId))
window.addEventListener("resize", () => {
myChart.resize()
})
setTimeout(function () {
myChart.on("updateAxisPointer", function (event) {
const xAxisInfo = event.axesInfo[0]
if (xAxisInfo) {
const dimension = xAxisInfo.value + 1
myChart.setOption({
series: {
id: "pie",
label: {
formatter: "{b}: {@[" + dimension + "]} ({d}%)"
},
encode: {
value: dimension,
tooltip: dimension
}
}
})
}
})
// 使用刚指定的配置项和数据显示图表。
myChart.setOption(setOptions.value, true)
})
}
onMounted(() => {
initChart()
})
watch([chartData, chartId], () => {
initChart()
})
return {
setOptions,
initChart
}
}
}
</script>
以上是 求解:接完接口后echarts饼图和线图这种联动和共享数据集的图中饼图必须鼠标滑过或者点击才会出现? 的全部内容, 来源链接: utcz.com/p/936646.html