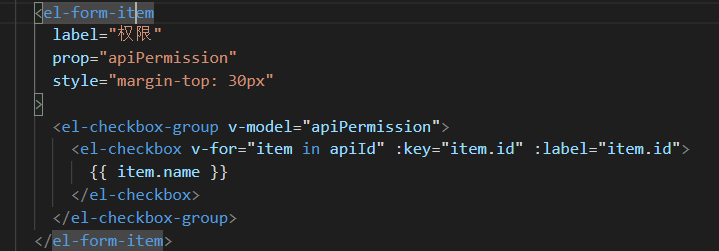
echarts饼图同时设置两个label标签产生的问题?
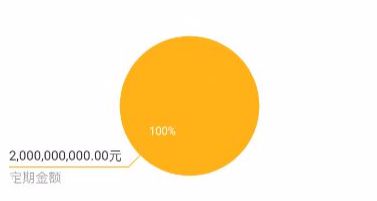
echarts饼图同时设置两个label标签,内(显示百分比)外(显示数据和文字描述)后,判断当一个数据为零时(目前只有两个数据),另一个数据百分比无法在整个饼图中垂直水平居中,怎么解决?
代码如下:
难道是我这个需求过分了吗
initPieChart(totalBalance, privateTotalBalance) { privateTotalBalance = 2000000000;
totalBalance = 0;
if (!!this.$refs.piecharts) {
var myChart = echarts.init(this.$refs.piecharts);
myChart.setOption({
color: ["#228BFF", "#FFB218"],
padding: [-80, 0],
series: [
{
type: "pie",
radius: "70%",
left: "center",
position: "outer",
startAngle: "45",
width: 680,
// minAngle: 10, //最小的扇区角度(0 ~ 360),用于防止某个值过小导致扇区太小影响交互
// avoidLabelOverlap: true, //是否启用防止标签重叠策略
label: {
alignTo: "edge",
padding: [0, 5],
lineHeight: 0,
formatter(v) {
var text = v.name;
var value_format = filterMoney(v.value);
console.log(v.value, "dadada");
let data = v.data;
if (data.value > 0) {
data.label.show = true;
data.labelLine.show = true;
}
console.log(data, "dota");
// let percent_format = v.percent + "%";
if (value_format.length <= 13) {
return (text = `{a|${value_format.slice(
0,
13
)}}\n{b|${text}}`);
} else if (
value_format.length > 13 &&
value_format.length <= 18
) {
return (text = `{a|${value_format.slice(
0,
18
)}}\n{b|${text}}`);
} else if (
value_format.length > 18 &&
value_format.length <= 24
) {
return (text = `{a|${value_format.slice(
0,
18
)}}\n{b|${b}}`);
} else if (
value_format.length > 24 &&
value_format.length <= 30
) {
return (text = `{a|${value_format.slice(
0,
10
)}}\n{b|${text}}`);
} else if (value_format.length > 30) {
return (text = `{a|${value_format.slice(
0,
10
)}}\n{b|${text}}`);
}
},
edgeDistance: 0,
// emphasis: {
// itemStyle: {
// borderColor: "#fff",
// borderWidth: 2,
// },
// },
rich: {
a: {
fontSize: 12,
color: "#2e2f30",
lineHeight: 20,
},
b: {
fontSize: 12,
color: "#999",
lineHeight: 20,
},
},
},
labelLine: {
length: 15,
length2: 140,
// maxSurfaceAngle: 1,
},
data: [
{
name: "活期金额 ",
value: totalBalance,
label: { show: false },
labelLine: { show: false },
},
{
name: "定期金额 ",
value: privateTotalBalance,
label: { show: false },
labelLine: { show: false },
},
],
},
{
radius: "70%", //饼图的半径大小
type: "pie",
startAngle: "45",
hoverAnimation: true, //防止饼图点击放大
// minAngle: 20, //最小的扇区角度(0 ~ 360),用于防止某个值过小导致扇区太小影响交互
// avoidLabelOverlap: true, //是否启用防止标签重叠策略
label: {
fontSize: 10,
formatter(v) {
let data2 = v.data;
if (data2.value > 0) {
data2.label.show = true;
}
return `${v.percent}%`;
},
position: "inner",
lineHeight: 0,
},
data: [
{
value: totalBalance,
label: { show: false },
},
{
value: privateTotalBalance,
label: { show: false },
// itemStyle:{ normal:{ label:{ show: false }}}
},
],
// itemStyle: {
// emphasis: {
// borderWidth: 1.5,
// borderColor: "#fff",
// },
// },
},
],
});
}
},
以上是 echarts饼图同时设置两个label标签产生的问题? 的全部内容, 来源链接: utcz.com/p/936430.html