echarts折线图 上下拖动数据怎么做?
如图这样: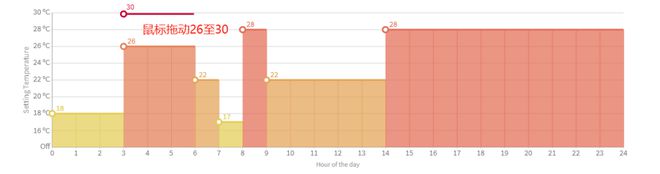 ,
,
回答:
又是你,再给你个官方例子 https://echarts.apache.org/ex...
这是我之前做的相关功能,是柱状图,你可以参考下,里面很多东西你应该用不到,你自己精简下
<!DOCTYPE html><html lang="en">
<head>
<meta charset="UTF-8">
<meta name="viewport" content="width=device-width, initial-scale=1.0">
<title>Document</title>
<style>
html, body{
width: 100%;
height: 100%;
padding: 0;
margin: 0;
}
#m-chart{
margin: 10px;
width: 800px;
height: 800px;
}
</style>
</head>
<body>
<div id="m-chart" class="charts"></div>
</body>
<script src="http://libs.baidu.com/jquery/2.0.0/jquery.min.js"></script>
<script src="https://lib.baomitu.com/echarts/5.1.2/echarts.common.min.js"></script>
<script>
let myChart = echarts.init(document.getElementById('m-chart'));
let symbolSize = 20;
let originData = [25, 25, 25, 25];
let xAxis = ['08时-14时', '14时-20时', '20时-02时', '02时-08时']
let ratioData = originData.map((item, index) => {
return {
name: xAxis[index],
value: item
}
})
let activeRatioData
setCharts();
function setCharts(){
let option = {
grid:{
left: '5%',
top: '10%',
right: '5%',
bottom: '7%'
},
xAxis: {
type: 'category', // 'category' 'value'
name: '时程',
data: xAxis,
splitLine: {
show: false
}
},
yAxis: {
min: 0,
max: 100,
interval: 10,
type: 'value',
name: '比例(%)'
},
series: [
{
id: 'scfp',
type: 'bar',
//smooth: true,
//symbolSize: symbolSize,
data: [],
label: {
normal: {
show: true,
color: '#fff',
fontWeight: 'bold',
fontSize: 16,
position: 'inside', //insideTop inside [50%', '50%'] 'top'
//offset: [0, 10]
}
},
markPoint: {
symbol: 'circle',
symbolSize: symbolSize,
itemStyle: {
normal: {
color: '#00f'
}
},
silent: true,
animation: false,
data: [],
}
}
]
};
myChart.setOption(option);
setOptionData()
setTimeout(setGraphic, 0);
}
function setOptionData(){
let data = ratioData.map(item => {
return {
name: item.name,
value: item.value,
itemStyle: {
normal: {
color: item.disabled ? '#71c6ff' : '#1692f4', // 71c6ff
barBorderRadius: [5, 5, 0, 0]
},
emphasis: {
color: item.disabled ? '#71c6ff' : '#1692f4',
barBorderRadius: [5, 5, 0, 0]
}
}
}
})
myChart && myChart.setOption({
series: [{
id: 'scfp',
data: data,
markPoint: {
data: ratioData.map((item, index) => {
return { coord: item.disabled ? undefined : [index, item.value] }
})
}
}]
});
}
function setGraphic(){
// Add shadow circles (which is not visible) to enable drag.
myChart.setOption({
graphic: echarts.util.map(ratioData, function (item, dataIndex) {
var position = myChart.convertToPixel('grid', [item.name, item.value])
return {
type: 'circle',
position: position,
shape: {
cx: 0,
cy: 0,
r: item.disabled ? 0 : (symbolSize / 2)
},
invisible: true, // false 显示拖拽的点
draggable: item.disabled ? false : true,
ondragstart: function(){
setTimeout(function(){
activeRatioData = JSON.parse( JSON.stringify(ratioData) )
}, 0)
},
ondrag: echarts.util.curry(onPointDragging, dataIndex),
ondragend: echarts.util.curry(function onDragend(index){
setTimeout(dragCallBack, 100, index)
}, dataIndex),
z: 100
};
})
});
}
function onPointDragging(dataIndex) {
if(!onPointDragging.offSetTime){
onPointDragging.offSetTime = setTimeout(_ => {
let data = myChart.convertFromPixel('grid', this.position);
let val = +data[1].toFixed(0);
changeVal(val, dataIndex)
setOptionData()
onPointDragging.offSetTime = null
}, 100)
}
}
function changeVal(val, dataIndex){
if(activeRatioData){
ratioData = JSON.parse( JSON.stringify(activeRatioData) )
activeRatioData = null
}
let count = 100 //可改变元素的总值
//从大到小排序,从后面pop
let narr = ratioData.filter((item, index) => {
if(item.disabled){
count -= item.value
}else if(index != dataIndex){
return true
}
}).sort((a, b) => b.value - a.value);
val = val > count ? count : val < 0 ? 0 : val;
val = +val.toFixed(0)
let diff = ratioData[dataIndex].value - val //差值,平均分配给可改变的元素
let diffItem = (diff / narr.length) | 0;
let item = narr.pop();
while (item) {
let v = item.value + diffItem
if(v < 0){
//diff -30 ; diffItem -10 ; item.value 5 ; v -5
// ==> diff -25 item.value 0
diff += item.value
item.value = 0
}else if(v > 100){
//diff 30 ; diffItem 10 ; item.value 98 ; v 108
// ==> diff 28 item.value 100
diff += item.value - 100
item.value = 100
}else{
//diff 30 ; diffItem 10 ; item.value 28 ; v 38
// ==> diff 20 item.value 38
diff -= diffItem
item.value = v
}
diffItem = (diff / narr.length) | 0;
item = narr.pop();
}
ratioData[dataIndex].value = val
}
function dragCallBack(index){
ratioData[index].disabled = true
setOptionData()
setGraphic()
let nodis = ratioData.filter(item => !item.disabled)
if(nodis.length == 1){
let i = ratioData.indexOf(nodis[0])
dragCallBack(i)
}
}
</script>
</html>
回答:
最后总结一下我操作的方法:
//鼠标事件,mousedown/mousemove/mouseup
this.myChart.getZr().on("mousedown", (params) => { //do something
//将params.offsetX,params.offsetY通过myChart.convertFromPixel方法转换成图表的x轴和y轴,就可以操作数据了
const axisData = this.myChart.convertFromPixel("grid", [
params.offsetX,
params.offsetY,
]);
});
//鼠标按下时 _this.myChart.getZr().on("mousedown", (params) => {
_this.mouseModifying = true;
//显示鼠标模拟线段
_this.showMouseLine(params);
});
//鼠标滑动时
_this.myChart.getZr().on("mousemove", (params) => {
if (_this.mouseModifying) {
_this.mouseMoveing = true;
//显示鼠标模拟线段
_this.showMouseLine(params);
}
});
// 鼠标拖拽事件 松开时
_this.myChart.getZr().on("mouseup", (params) => {
try {
if (_this.mouseModifying) {
const mouseData = _this.myChart.convertFromPixel("grid", [
params.offsetX,
params.offsetY,
]);
//x轴的下标
_this.mousedownXAxisPosition = mouseData[0];
...
}
_this.mouseModifying = false;
_this.mouseMoveing = false;
} catch (e) {
//鼠标作用点超出图表时
_this.mouseModifying = false;
_this.mouseMoveing = false;
}
});
let erd = elementResizeDetectorMaker();
erd.listenTo(document.getElementById("chart"), function (element) {
_this.$nextTick(function () {
_this.myChart.resize(); //变化重新渲染图
});
});
//显示鼠标线段 showMouseLine(params) {
const _this = this;
try {
//鼠标移动时
if (this.mouseMoveing) {
this.option.color.length = this.option.color.length - 1;
this.option.series.length = this.option.series.length - 1;
}
const mouseData = this.myChart.convertFromPixel("grid", [
params.offsetX,
params.offsetY,
]);
//超过图表外不操作数据
if (
mouseData[0] < 0 ||
mouseData[0] > 24 ||
mouseData[1] < this.yAxisTemperationMinValue ||
mouseData[1] > this.yAxisTemperationMaxValue
) {
return false;
}
...
} catch (e) {
//范围超出时
//console.log(e.message,e.stack);
if (e.message === "Invalid array length") {
_this.mouseModifying = false;
_this.mouseMoveing = false;
_this.isInputChange = false;
}
}
},
以上是 echarts折线图 上下拖动数据怎么做? 的全部内容, 来源链接: utcz.com/p/935853.html