关于Echarts 的极坐标系图配置参数,大半天了查的快吐了用的多的大佬磕头请教!!!
两个问题:
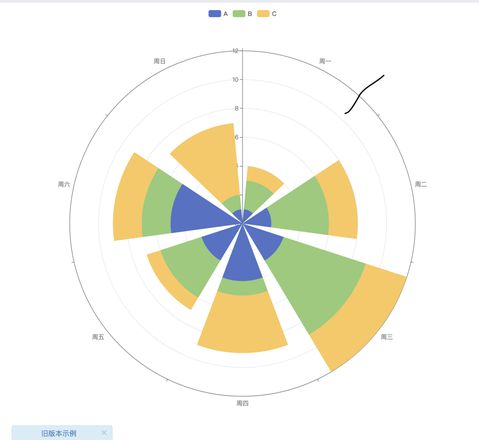
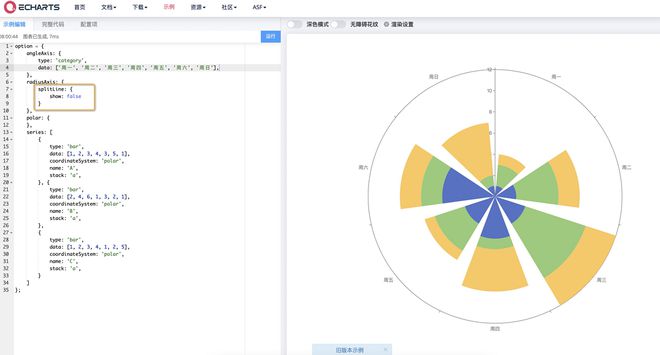
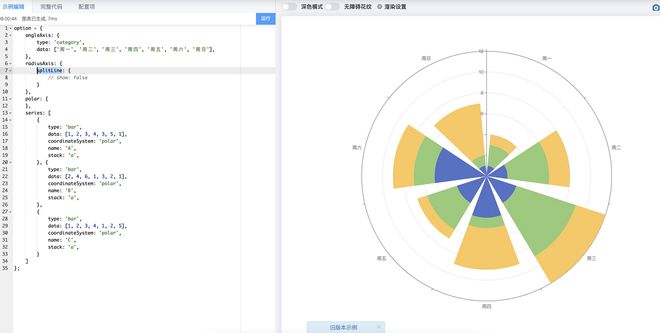
- 这官网的图中这些内圈怎么显示CV死活没有,文档也没找到。
2.我这个里面蓝色部分每一个的颜色怎么设置?还需要设置透明色让下面数值显示出来,死活只找到单独的设置不能放数组;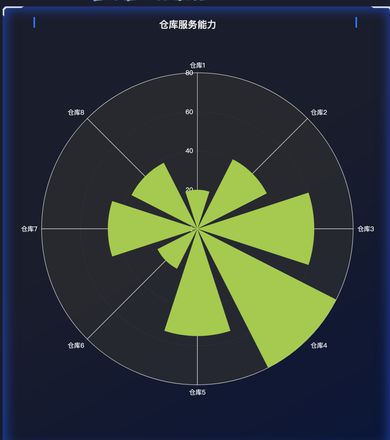
这个对应参数配置,我会在代码中标明!
3.具体代码:
<!-- * @Author: 中间极坐标图
* @Date: 2021-06-04 08:20:38
* @LastEditTime: 2021-06-05 18:33:16
* @LastEditors: Please set LastEditors
* @Description: In User Settings Edit
* @FilePath: /iphmart-datascreen2021-front/src/views/materiel/components/center/center.vue
-->
<template>
<div class="box">
<div class="left"></div>
<div class="right"></div>
<Echart :options="option"></Echart>
</div>
</template>
<style lang="scss" scoped>
.box {
.left,
.right {
width: 3px;
height: 20px;
background-color: #0278fe;
}
.left {
position: absolute;
top: 20px;
left: 8%;
}
.right {
position: absolute;
top: 20px;
right: 8%;
}
}
</style>
<script>
import Echart from "@/common/echart";
export default {
components: {
Echart,
},
data() {
return {
option: {},
warehouses: [
"仓库1",
"仓库2",
"仓库3",
"仓库4",
"仓库5",
"仓库6",
"仓库7",
"仓库8",
],
isNumbers: [20, 40, 60, 80, 55, 23, 46, 38],
color: [
"#263366",
"#3535A9",
"#257ED8",
"#7540BE",
"#27A5A5",
"#CB445A",
"#37A453",
"#D1AE26",
],
};
},
mounted() {
this.option = {
title: {
text: "仓库服务能力",
textStyle: {
color: "#E8E9EA",
},
top: "20px",
left: "39.5%",
},
tooltip: {
trigger: "axis",
axisPointer: {
type: "cross",
},
},
angleAxis: {
type: "category",
data: this.warehouses,
boundaryGap: false,
splitLine: {
show: true,
},
axisLine: {
show: true,
},
axisTick: {
//坐标轴刻度设置
show: true,
},
axisLabel: {
//最外层刻度标签设置
textStyle: {
// color: 'red'
},
},
},
radiusAxis: {
type: "value",
data: [20, 40, 60, 80],
axisLine: {
show: true,
lineStyle: {
//中间竖线样式设置
// color: "red"
},
},
axisTick: {
//坐标轴刻度设置
show: true,
},
splitArea: {
show: true,
areaStyle: {
color: "#333333",
// opacity: 0.3
},
},
},
polar: {
show: true,
center: ["50%", "50%"],
},
series: [
{
type: "bar",
data: this.isNumbers,
coordinateSystem: "polar",
name: this.warehouses,
stack: this.warehouses,
/* 问题在这颜色只能单独设置不能放数组!!!! */
color: 'red'
},
],
};
},
};
</script>
回答:
修改series中data的配置即可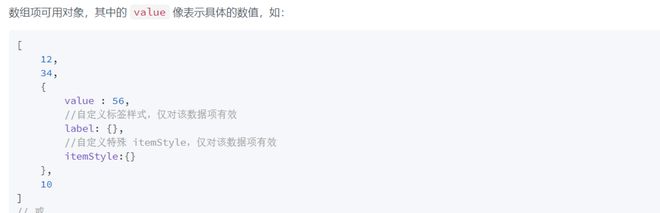
可以把之前的isNumbers配置成这种格式
const isNumbers2= [ {
value: 20,
itemStyle:{
color: '#263366',
opacity: 0.8
}
},
{
value: 40,
itemStyle:{
color: '#257ED8',
opacity: 0.8
}
},
{
value: 60,
itemStyle:{
color: '#7540BE',
opacity: 0.8
}
},
{
value: 80,
itemStyle:{
color: '#27A5A5',
opacity: 0.8
}
},
{
value: 46,
itemStyle:{
color: '#CB445A',
opacity: 0.8
}
},
{
value: 23,
itemStyle:{
color: '#37A453',
opacity: 0.8
}
},
{
value: 38,
itemStyle:{
color: '#D1AE26',
opacity: 0.8
}
},
]
回答:
线是通过 splitLine 来设置的。
那你用普通的南丁格尔玫瑰图,不就好了

回答:
别沉啊,有大佬做过吗?扇页改变不同颜色能传数组吗?目前就只看到一个个设置
回答:
是要这种效果吗
以上是 关于Echarts 的极坐标系图配置参数,大半天了查的快吐了用的多的大佬磕头请教!!! 的全部内容, 来源链接: utcz.com/p/935432.html