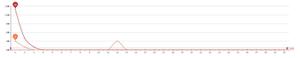
为什么echarts折线图在弄完坐标点上下滑动后tooltip就无法显示了?
V8L8TA9.jpg") .
.
鼠标划上去没有数据框,只有x,y轴的坐标显示。
<template> <div ref="dom" style="height: 400px" class="charts chart-bar"></div>
</template>
<script>
import * as echarts from 'echarts'
export default {
name: 'ChartLine',
props: {
text: String,
subtext: String,
yName: String,
},
data() {
return {
dom: null,
symbolSize: 10,
oldValueArr: [],
xPoint: null,
valueDatas: [
[
[0, 10],
[1, 10],
[2, 20],
[3, 30],
[4, 36],
[5, 20],
[6, 25],
[7, 20],
[8, 21],
[9, 22],
[10, 23],
[11, 25],
[12, 10],
[13, 11],
[14, 19],
[15, 20],
[16, 12],
[17, 13],
[18, 12],
[19, 1],
[20, 21],
[21, 18],
[22, 10],
[23, 12],
],
[
[0, 20],
[1, 0],
[2, 10],
[3, 10],
[4, 26],
[5, 30],
[6, 15],
[7, 30],
[8, 11],
[9, 32],
[10, 3],
[11, 15],
[12, 20],
[13, 31],
[14, 9],
[15, 10],
[16, 22],
[17, 3],
[18, 32],
[19, 19],
[20, 31],
[21, 8],
[22, 0],
[23, 22],
],
],
}
},
methods: {
resize() {
this.dom.resize()
},
mouseUp(dataIndex, e) {
console.log(e, e.target.position)
let dataArr = this.chart2.convertFromPixel('grid', e.target.position)
if (this.oldValueArr[1] == dataArr[1].toFixed(2)) {
return
}
},
onPointDragend() {
let dataArr = this.chart2.convertFromPixel('grid', this.position)
if (this.oldValueArr[1] == dataArr[1].toFixed(2)) {
return
}
//执行保存数据相关操作
},
mouseDown(dataIndex, e) {
let dataArr = this.chart2.convertFromPixel('grid', e.target.position)
this.oldValueArr = dataArr
},
reduceDimension(arr) {
return Array.prototype.concat.apply([], arr) //数据降维
},
},
mounted() {
this.dom = echarts.init(this.$refs.dom)
this.dom.setOption({
title: {
text: this.text,
subtext: this.subtext,
x: 'center',
},
grid: {
left: 50,
top: 40,
},
//测试legend的代码,没找到合适的解决办法
legend: {
data: ['实际曲线B', '预测曲线A'],
top: '2%',
left: 'center',
itemWidth: 10, //图例的宽度
itemHeight: 10, //图例的高度
textStyle: {
//图例文字的样式
color: '#999',
fontSize: 14,
},
z: 2000,
},
tooltip: {
trigger: 'axis',
textStyle: {
align: 'left',
},
axisPointer: {
type: 'cross',
label: {
backgroundColor: '#09cba0',
},
},
formatter: function (params) {
console.log(params)
},
},
xAxis: {
min: 0,
max: 23,
type: 'value',
axisLabel: {
formatter(value) {
return value + ':00' // 格式时间显示方式
},
},
axisLine: { onZero: false },
},
yAxis: {
min: 0,
max: 36,
type: 'value',
name: this.yName,
axisLine: { onZero: false },
},
series: [
{
id: 'b',
name: '实际曲线B',
type: 'line',
smooth: true,
symbolSize: this.symbolSize, // 为了方便拖拽,把 symbolSize 尺寸设大了。
data: this.valueDatas[1],
},
{
id: 'a',
name: '预测曲线A',
type: 'line',
smooth: true,
symbolSize: this.symbolSize, // 为了方便拖拽,把 symbolSize 尺寸设大了。
data: this.valueDatas[0],
},
],
})
this.dom.setOption({
graphic: this.reduceDimension(
this.valueDatas.map((elment, i) => {
return echarts.util.map(elment, (dataItem, dataIndex) => {
const that = this
return {
type: 'circle',
shape: {
// 圆点的半径。
r: that.symbolSize / 2,
},
position: that.dom.convertToPixel('grid', dataItem),
// 这个属性让圆点不可见(但是不影响他响应鼠标事件)。
invisible: true,
// 这个属性让圆点可以被拖拽。
draggable: true,
// 把 z 值设得比较大,表示这个圆点在最上方,能覆盖住已有的折线图的圆点。
z: 100,
// 元素正在拖动时触发
ondrag:
i == 0
? echarts.util.curry(
function (dataIndex) {
that.xPoint = null
that.xPoint = dataIndex
let origin = that.dom.convertToPixel('grid', elment[dataIndex]) // 得到每个圆点原始位置
if (this.position[1] > 330) {
this.position[1] = 330
} else if (this.position[1] < 40) {
this.position[1] = 40
}
this.position[0] = origin[0] // 控制每个点位只能在y轴方向移动
// this.position[1] = origin[1] // 控制每个点位只能在x轴方向移动
// 实时获取拖动的点位信息并根据此信息重新画图
elment[dataIndex] = that.dom.convertFromPixel('grid', this.position)
elment[dataIndex][0] = that.xPoint
that.dom.setOption({
series: [
{
id: i == 0 ? 'a' : 'b',
data: elment,
},
],
})
},
dataIndex,
i
)
: '',
// 用户完成元素拖动后触发
ondragend:
i == 0
? echarts.util.curry(
function (dataIndex) {
setTimeout(function () {
elment[dataIndex][0] = that.xPoint
elment[dataIndex][1] = elment[dataIndex][1].toFixed(2)
alert('拖动完成: ' + elment[dataIndex])
elment[dataIndex] = that.dom.convertFromPixel('grid', this.position)
}, 500)
},
dataIndex,
i
)
: '', // 拖动完成
// 事件会在鼠标移动到指定对象时发生
onmousemove: echarts.util.curry(
function (dataIndex, a) {
console.log(dataIndex, a, a.offsetX, a.offsetY)
setTimeout(() => {
that.dom.dispatchAction({
type: 'showTip', //tooltip为axis属性 使用 showTip 绑定tooltip
x: a.offsetX,
y: a.offsetY,
})
}, 100)
},
dataIndex
// i
),
}
})
})
),
})
},
// beforeDestroy() {
// off(window, 'resize', this.resize)
// },
}
</script>
回答:
应该是this的问题,你可以将
this.dom = echarts.init(this.$refs.dom)this.dom.setOption({
...
})
换成
let dom = echarts.init(this.$refs.dom)dom.setOption({
...
})
回答:
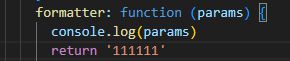
因为你tooltip的formatter写了一个函数,却没有返回值,默认返回undefined了,可以把这个注释掉,或者里面加上你自定义的返回值
formatter: function (params) { console.log(params)
}
回答:
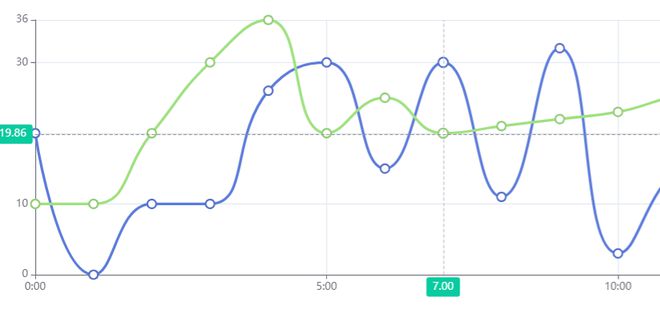
上面两位的方法都试了但还是出不来,难道是因为我在vue3的项目里写的这个测试demo
 6V}P}V9L2)~GOUL7ON.jpg" title="@[L
6V}P}V9L2)~GOUL7ON.jpg">
以上是 为什么echarts折线图在弄完坐标点上下滑动后tooltip就无法显示了? 的全部内容, 来源链接: utcz.com/p/934463.html