echarts 曲线图表背景区域划分?
echarts 曲线图表背景区域划分?

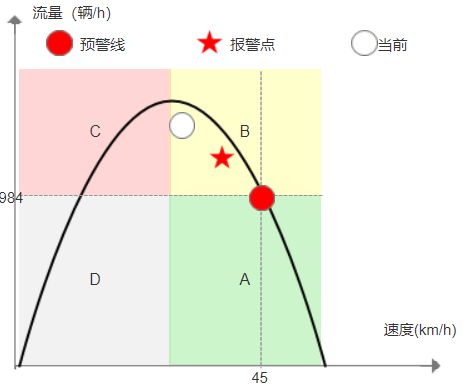
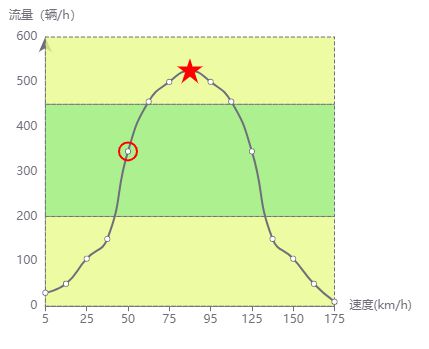
类似于图中的echarts 曲线图表背景区域划分,分为4块不同的颜色,这个怎么弄呢,谢谢
data: [ [{
name: '',
xAxis: 0,
yAxis: 0,
itemStyle: {
color: 'rgba(233,250,140,0.8)'
},
}, {
xAxis: 80,
yAxis: 200
}
],
[{
name: '',
yAxis: 200,
itemStyle: {
color: 'rgba(153,236,116,0.8)'
},
}, {
yAxis: 450,
}],
[{
name: '',
yAxis: 450,
itemStyle: {
color: 'rgba(233,250,140,0.8)'
}
}, {
yAxis: 1000,
}]
]
效果图如下:
没有关于x轴分割
回答:
可以使用自定义系列画出背景
https://echarts.apache.org/examples/zh/index.html#chart-type-...
回答:
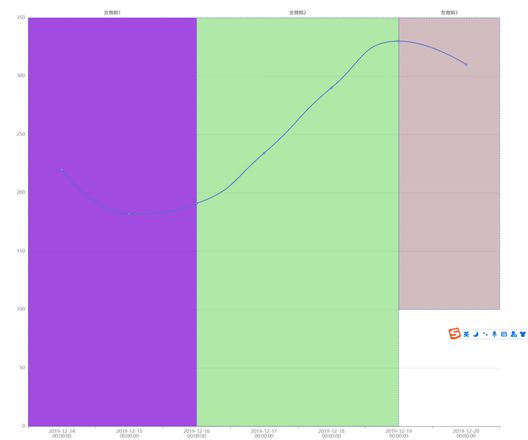
改一下可以用
option = { tooltip: {
trigger: 'axis'
},
xAxis: {
data: [
'2019-12-14 00:00:00',
'2019-12-15 00:00:00',
'2019-12-16 00:00:00',
'2019-12-17 00:00:00',
'2019-12-18 00:00:00',
'2019-12-19 00:00:00',
'2019-12-20 00:00:00'
],
axisLabel: {
formatter: function(res) {
return res.split(" ")[0] + "\n" + res.split(" ")[1];
}
}
},
yAxis: {
},
series: [{
name: "测试标域",
smooth: true,
type: 'line',
data:[220, 182, 191, 234, 290, 330, 310],
markArea: {
silent: true,
itemStyle: {
normal: {
borderWidth: 1,
borderType: 'dashed'
}
},
data: [[
{},
{
name: '发育期1',
xAxis: '2019-12-16 00:00:00',
itemStyle: {
color: getColor()
}
}
], [
{
name: '发育期2',
yAxis:0,
xAxis: '2019-12-16 00:00:00',
itemStyle: {
color: getColor()
}
},
{
xAxis: '2019-12-19 00:00:00'
}
], [
{
name: '发育期3',
yAxis:100,
xAxis: '2019-12-19 00:00:00',
itemStyle: {
color: getColor()
}
},
{}
]]
},
}]
};
function getColor() {
var c1 = parseInt(Math.random() * 255);
var c2 = parseInt(Math.random() * 255);
var c3 = parseInt(Math.random() * 255);
var c4 = Math.random();
return "rgba("+c1+","+c2+","+c3+","+c4+")";
}

以上是 echarts 曲线图表背景区域划分? 的全部内容, 来源链接: utcz.com/p/934425.html


