echarts geo3D 使用使用纹理贴图,出现颜色重叠的现象?
我想在geo3D地图中实现涟漪效果,但是颜色有重合。
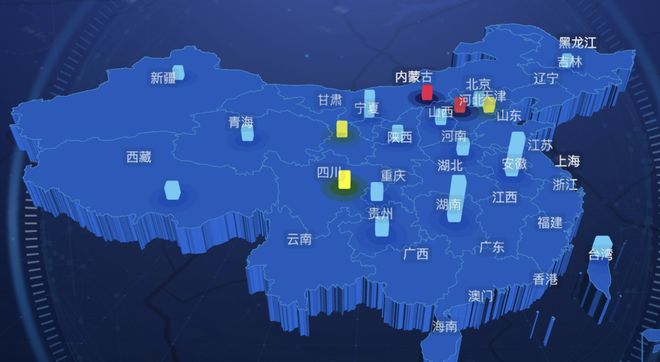
图片效果是这样的:
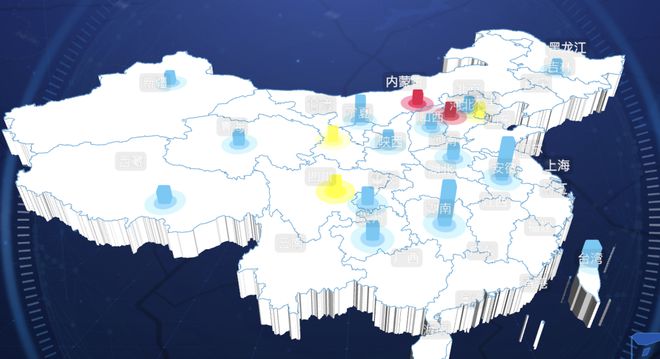
但是实际的涟漪效果的颜色是这样的:
黄色和蓝色还好,但是红色的涟漪在蓝色的地图上直接变成了黑色。
代码是这样的:
const canvas = document.createElement('canvas')
this.bg = echarts.init(canvas,null,{ width:1024,
height:1024,
})
let chartOption = {
geo:[{
show:true,
map:'mapName',
left:'0',
right:'0',
top:'0',
bottom:'0',
itemStyle:{
areaColor:'transparent',
borderWidth:0,
borderColor:'#fff'
}
}],
series:[
{
type:'effectScatter',
coordinateSystem:'geo',
rippleEffect:{
period:4,
brushType:'fill',
scale:'8',
},
itemStyle:{
color:'rgb(124,200,243)',
// color:'#1B2CE3' //#FA81DE //#0BBFA4 //#C3C9C9 //#BAABB8
},
data:this.getPointerData(map)
},
]
}
this.bg.setOption(chartOption)
geo3D是这样写的
geo3D: [
{ map: "mapName",
zlevel:1,
roam:true,
regionHeight: 4, //三维地图区域的高度,即模型的高度
top: topNum, //距离容器上侧的距离
bottom:'-10%',
right:rightNum,
label: {
show: true,
distance:50, //是要有些距离,标签才不会随着地图的缩放,旋转移动
textStyle: {
color: "#fff",
fontSize: this.labSize, //默认12
opacity: 0.7,
backgroundColor: "rgba(0,0,0,0.1)",
},
},
//鼠标高亮时图形和标签样式
emphasis: {
label:{
formatter:(params)=>{
this.areaName = params.name
console.log(this.areaName,'1111');
return params.name
}
},
itemStyle:{
opacity:1,
}
},
tooltip: {}, //官网山series里面是没有的
itemStyle: {
color: "rgb(23,85,177)", //这个才是颜色
// color: "transparent",
opacity:1,
borderWidth: borWidth, //默认0.5
// borderWidth:0,
borderColor: "#3296d1",
},
viewControl:{
distance:distanceNum, //默认视角距离主体的距离
// alpha:90,
// beta:90,
minAlpha:0,
maxAlpha:90,
},
//三维图形的着色效果
shading:'realistic',
light:{
main:{
color:'#fff',
intensity:1.2,
shadow:false,
//光的y轴,x轴的角度
alpha:40,
beta:20,
},
ambient: {
intensity: 0.3
}
},
// 贴图
// shading:'color',
// colorMaterial:{
// detailTexture:this.bg,
// // detailTexture:
// textureTiling:1
// },
realisticMaterial:{
detailTexture:this.bg,
}
}]
网上搜了下也都是这个方法,但是没有找有出现这种问题的,不知道是不是哪里写错了,导致颜色有重叠?
回答:
请问楼主解决了咩,我也遇到了一样的问题,还没找到解决方案
以上是 echarts geo3D 使用使用纹理贴图,出现颜色重叠的现象? 的全部内容, 来源链接: utcz.com/p/933121.html


