在vue中使用echars实现上浮与下钻效果
第一步:
在vue项目中安装echars
npm i echars -S
第二步:
main.js配置 这里是全局引入
//引入echars
import echarts from 'echarts'
Vue.prototype.$echarts = echarts
第三步
直接上代码
<template>
<div id="container">
<header>浙江省echars地图</header>
<div id="echarsMap"></div>
</div>
</template>
<script>
//引入json
import zhejiang from "../../../static/zhejiangJson/zhejiang";
import hangzhou from "../../../static/zhejiangJson/hangzhou";
import huzhou from "../../../static/zhejiangJson/huzhou";
import jiaxing from "../../../static/zhejiangJson/jiaxing";
import jinhua from "../../../static/zhejiangJson/jinhua";
import lanzhou from "../../../static/zhejiangJson/lanzhou";
import lishui from "../../../static/zhejiangJson/lishui";
import ningbo from "../../../static/zhejiangJson/ningbo";
import quzhou from "../../../static/zhejiangJson/quzhou";
import shaoxing from "../../../static/zhejiangJson/shaoxing";
import taizhou from "../../../static/zhejiangJson/taizhou";
import wenzhou from "../../../static/zhejiangJson/wenzhou";
import zhoushan from "../../../static/zhejiangJson/zhoushan";
export default {
name: "echars1",
data() {
return {
cityName: "",//区域的名字
markerArr: [], //接收散点图数据
};
},
methods: {
//画地图
initEchars(cityName) {
var cityMap = {
杭州市: hangzhou,
丽水市: lishui,
兰州市: lanzhou,
台州市: taizhou,
嘉兴市: jiaxing,
宁波市: ningbo,
温州市: wenzhou,
湖州市: huzhou,
绍兴市: shaoxing,
舟山市: zhoushan,
衢州市: quzhou,
金华市: jinhua
};
var name = [cityName];
var pos = {
leftPlus: 115,
leftCur: 150,
left: 198,
top: 50
};
var line = [[0, 0], [8, 11], [0, 22]];
// style
var style = {
font: '18px "Microsoft YaHei", sans-serif',
textColor: "#eee",
lineColor: "rgba(147, 235, 248, .8)"
};
if (cityName == "" || cityName == "浙江") {
cityName = "浙江";
this.$echarts.registerMap("浙江", zhejiang);
}
let mapCharts = this.$echarts.init(document.getElementById("echarsMap"));
let mapCharts_option = {
//鼠标悬浮点标记
// tooltip: {
// padding: 0,
// enterable: true,
// transitionDuration: 1,
// textStyle: {
// color: "#000",
// decoration: "none"
// },
// formatter: function(params) {
// var tipHtml = "";
// tipHtml =
// '<div style="width:100%;height:auto;background:rgba(22,80,158,1);border:1px solid rgba(7,166,255,0.7)">' +
// '<div style="width:100%;height:40px;line-height:40px;border-bottom:2px solid rgba(7,166,255,0.7);padding:0 20px">' +
// '<i style="display:inline-block;width:8px;height:8px;background:#16d6ff;border-radius:40px;">' +
// "</i>" +
// '<span style="margin-left:10px;color:#fff;font-size:16px;">' +
// params.data.org_name +
// "</span>" +
// "</div>" +
// '<div style="padding:20px">' +
// '<p style="color:#fff;font-size:12px;">' +
// '<i style="display:inline-block;width:10px;height:10px;background:#16d6ff;border-radius:40px;margin:0 8px">' +
// "</i>" +
// "工程名称:" +
// '<span style="color:#f48225;margin:0 6px;">' +
// params.data.name +
// "</span>" +
// "</p>" +
// "</div>" +
// "</div>";
// return tipHtml;
// }
// },
//单词意思 图形图表
graphic: [
{
type: "group",
left: pos.left,
top: pos.top - 4,
children: [
{
type: "line",
left: 0,
top: -20,
shape: {
x1: 0,
y1: 0,
x2: 60,
y2: 0
},
style: {
stroke: style.lineColor
}
},
{
type: "line",
left: 0,
top: 20,
shape: {
x1: 0,
y1: 0,
x2: 60,
y2: 0
},
style: {
stroke: style.lineColor
}
}
]
},
{
id: "",
type: "group",
left: pos.left + 2,
top: pos.top,
children: [
{
type: "polyline",
left: 90,
top: -12,
shape: {
points: line
},
style: {
stroke: "transparent",
key: name[0]
},
onclick: function() {}
},
{
type: "text",
left: 0,
top: "middle",
style: {
text: "浙江",
textAlign: "center",
fill: style.textColor,
font: style.font
},
onclick: () => {
mapCharts.clear();
this.$echarts.registerMap("浙江", zhejiang);
mapCharts_option.geo.map = "浙江";
mapCharts.setOption(mapCharts_option, true);
}
},
{
type: "text",
left: 0,
top: 10,
style: {
text: "zhejiang",
textAlign: "center",
fill: style.textColor,
font: '12px "Microsoft YaHei", sans-serif'
},
onclick: () => {
mapCharts.clear();
this.$echarts.registerMap("浙江", zhejiang);
mapCharts_option.geo.map = "浙江";
mapCharts.setOption(mapCharts_option, true);
}
}
]
}
],
//设置地图
geo: {
map: cityName,
zoom: "1.2", //缩放比例
scaleLimit: {
//缩放的限度
min: 1,
max: 30
},
roam: true, //单词意思是漫步 实际是可以拖拽
label: {
//文字的颜色 单词意思标签
normal: {
//静态的时候显示的默认样式
show: true,
color: "#fff"
},
emphasis: {
//鼠标移入动态的时候显示的默认样式
// show: false,
// color:'#333'
}
},
itemStyle: {
//区域设置
normal: {
borderColor: "rgba(147, 235, 248, 1)",
borderWidth: 1,
areaColor: {
type: "radial",
x: 0.5,
y: 0.5,
r: 0.8,
colorStops: [
{
offset: 0,
color: "rgba(147, 235, 248, 0)" // 0% 处的颜色
},
{
offset: 1,
color: "rgba(147, 235, 248, .2)" // 100% 处的颜色
}
],
globalCoord: false // 缺省为 false
},
shadowColor: "rgba(128, 217, 248, 1)",
shadowOffsetX: -2,
shadowOffsetY: 2,
shadowBlur: 10
},
emphasis: {
//鼠标移入动态的时候显示区域颜色
areaColor: "#389BB7",
borderWidth: 0
}
}
},
series: [] //存点标记的地方
};
mapCharts.clear();
mapCharts.setOption(mapCharts_option, true);
mapCharts.resize();
mapCharts.on("click", params => {
//地图下钻
console.log(params);
if (cityMap[params.name]) {
this.cityName = params.name;
var url = cityMap[params.name]; //对应的拼音区域
this.$echarts.registerMap(params.name, url);
mapCharts_option.geo.map = params.name;
mapCharts.setOption(mapCharts_option, true);
}
});
},
},
mounted() {
this.initEchars("浙江");
}
};
</script>
<style lang="less" scoped>
#container {
width: 100%;
height: calc(100% - 78px);
background-color: pink;
#echarsMap {
width: 80%;
height: 80%;
background-color: #000;
margin: auto;
}
}
</style>
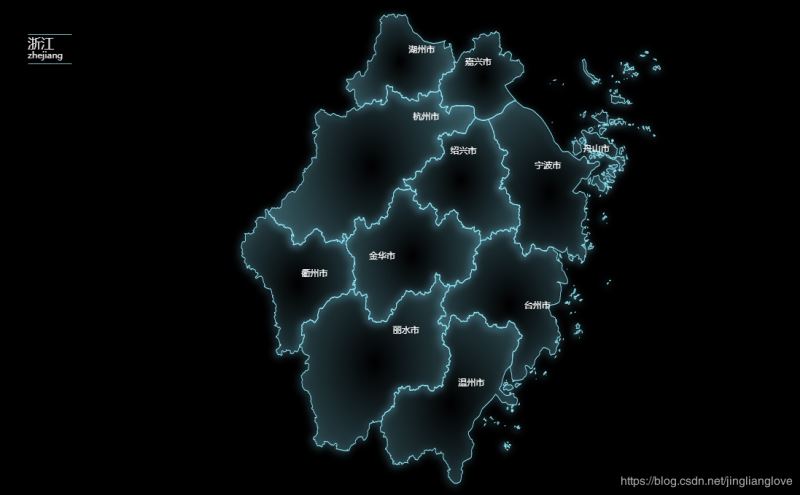
效果图
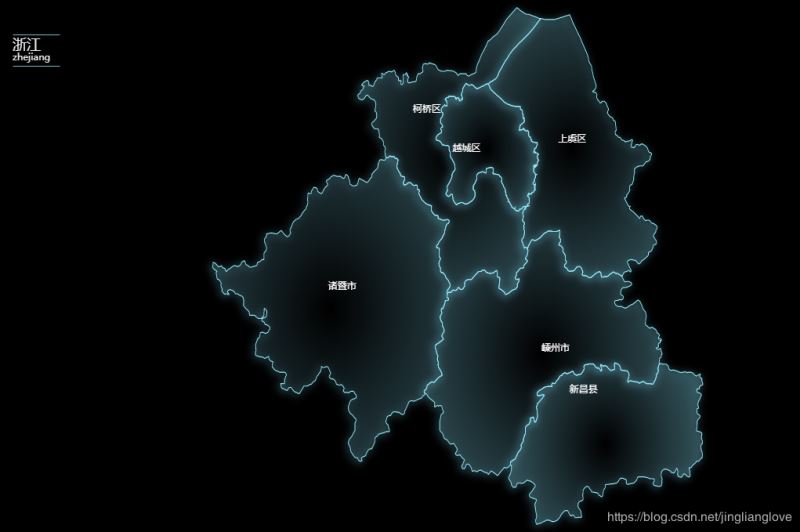
点击下一层
总结
以上所述是小编给大家介绍的在vue中使用echars实现上浮与下钻效果,希望对大家有所帮助,如果大家有任何疑问请给我留言,小编会及时回复大家的。在此也非常感谢大家对网站的支持!
如果你觉得本文对你有帮助,欢迎转载,烦请注明出处,谢谢!
以上是 在vue中使用echars实现上浮与下钻效果 的全部内容, 来源链接: utcz.com/p/236600.html