swiper+echarts实现多个仪表盘左右滚动效果
本文实例为大家分享了swiper+echarts实现仪表盘左右滚动效果的具体代码,供大家参考,具体内容如下
1、swiper的使用
a.首先加载插件
<!DOCTYPE html>
<html>
<head>
...
<link rel="stylesheet" href="dist/css/swiper.min.css" >
</head>
<body>
...
<script src="dist/js/swiper.min.js"></script>
...
</body>
</html>
b.HTML内容
<div class="swiper-container">
<div class="swiper-wrapper">
<div class="swiper-slide">Slide 1</div>
<div class="swiper-slide">Slide 2</div>
<div class="swiper-slide">Slide 3</div>
</div>
<!-- 如果需要分页器
<div class="swiper-pagination"></div>-->
<!-- 如果需要导航按钮 -->
<div class="swiper-button-prev"></div>
<div class="swiper-button-next"></div>
<!-- 如果需要滚动条
<div class="swiper-scrollbar"></div>-->
</div>
c.你可能想要给Swiper定义一个大小,当然不要也行。
.swiper-container {
width: 600px;
height: 300px;
}
d.初始化Swiper:最好是挨着</body>标签
<script>
var mySwiper = new Swiper ('.swiper-container', {
direction: 'vertical', // 垂直切换选项
loop: true, // 循环模式选项
// 如果需要分页器
pagination: {
el: '.swiper-pagination',
},
// 如果需要前进后退按钮
navigation: {
nextEl: '.swiper-button-next',
prevEl: '.swiper-button-prev',
},
// 如果需要滚动条
scrollbar: {
el: '.swiper-scrollbar',
},
})
</script>
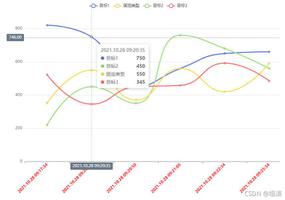
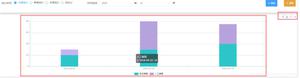
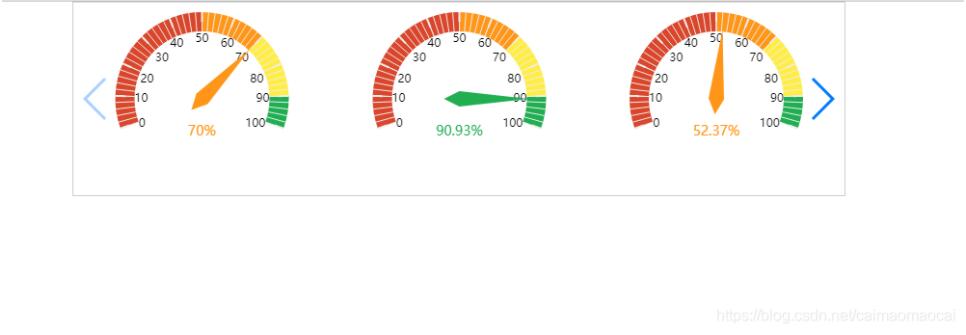
下面是我要实现的效果
代码如下
加载插件和样式
<!DOCTYPE html>
<html>
<head>
...
<link rel="stylesheet" href="dist/css/swiper.min.css" >
<style>
*{
margin:0;
padding:0;
}
.swiper-container{
height:200px;
width:800px;
margin:0 auto;
border:1px solid #ccc;
}
.swiper-slide{
display:flex;
}
.swiper-slide .chart{
flex:1;
}
</style>
</head>
<body>
...
<script src="https://cdn.bootcss.com/jquery/3.1.0/jquery.min.js"></script>
<script src="https://cdn.bootcss.com/echarts/4.1.0.rc2/echarts.min.js"></script>
<script src="dist/js/swiper.min.js"></script>
...
</body>
</html>
html结构
<div class="swiper-container">
<div class="swiper-wrapper">
<div class="swiper-slide">
<div class="chart" id="chart1">1</div>
<div class="chart" id="chart2">2</div>
<div class="chart" id="chart3">3</div>
</div>
<div class="swiper-slide">
<div class="chart" id="chart4">4</div>
<div class="chart" id="chart5">5</div>
<div class="chart" id="chart6">6</div>
</div>
<div class="swiper-slide">
<div class="chart" id="chart7">7</div>
<div class="chart" id="chart8">8</div>
<div class="chart" id="chart9">9</div>
</div>
</div>
<div class="swiper-button-prev"></div>
<div class="swiper-button-next"></div>
</div>
初始化swiper
var mySwiper = new Swiper('.swiper-container', {
autoplay: {
delay:5000
},//可选选项,自动滑动\
navigation: {
nextEl: '.swiper-button-next',
prevEl: '.swiper-button-prev',
}
})
初始化echarts
function initChart(obj){
var myChart = echarts.init(document.getElementById(obj));
var option = {
tooltip : {
formatter: "{a} <br/>{b} : {c}%"
},
series: [
{
type : "gauge",
center: ["50%", "50%"], // 默认全局居中
radius : "90%",
startAngle: 200,
endAngle: -20,
axisLine : {
show : true,
lineStyle : { // 属性lineStyle控制线条样式
color : [ //表盘颜色
[ 0.5, "#DA462C" ],//0-50%处的颜色
[ 0.7, "#FF9618" ],//51%-70%处的颜色
[ 0.9, "#FFED44" ],//70%-90%处的颜色
[ 1,"#20AE51" ]//90%-100%处的颜色
],
width : 20//表盘宽度
}
},
splitLine : { //分割线样式(及10、20等长线样式)
length : 10,
lineStyle : { // 属性lineStyle控制线条样式
width : 2
}
},
axisTick : { //刻度线样式(及短线样式)
length : 20
},
axisLabel : { //文字样式(及“10”、“20”等文字样式)
color : "black",
distance : 10//文字离表盘的距离
},
detail: {
formatter : "{score|{value}%}",
offsetCenter: [0, "40%"],
// backgroundColor: '#FFEC45',
height:20,
rich : {
score : {
// color : "#333",
fontFamily : "微软雅黑",
fontSize :14
}
}
},
data: [{
value: 56,
label: {
textStyle: {
fontSize: 12
}
}
}]
}
]
}
setInterval(function () {
option.series[0].data[0].value = (Math.random() * 100).toFixed(2) - 0;
myChart.setOption(option, true);
},2000);
}
调用初始化化echats函数
initChart('chart1')
initChart('chart2')
initChart('chart3')
initChart('chart4')
initChart('chart5')
initChart('chart6')
initChart('chart7')
initChart('chart8')
initChart('chart9')
插播一个echarts仪表盘的配置函数
function initChart(obj){
var myChart = echarts.init(document.getElementById(obj));
var option = {
tooltip : {
formatter: "{a} <br/>{b} : {c}%"
},
// toolbox: {
// feature: {
// restore: {},
// saveAsImage: {}
// }
// },
series: [
{
name: '业务指标',
type: 'gauge',
center: ["50%", "45%"], // 仪表位置
radius: "80%", //仪表大小
detail: {formatter:'{value}%'},
startAngle: 200, //开始角度
endAngle: -20, //结束角度
data: [{value: 30, name: '完成率'}],
axisLine: {
show: false,
lineStyle: { // 属性lineStyle控制线条样式
color: [
[ 0.5, new echarts.graphic.LinearGradient(0, 0, 1, 0, [{
offset: 1,
color: "#E75F25" // 50% 处的颜色
}, {
offset: 0.8,
color: "#D9452C" // 40% 处的颜色
}], false) ], // 100% 处的颜色
[ 0.7, new echarts.graphic.LinearGradient(0, 0, 1, 0, [{
offset: 1,
color: "#FFC539" // 70% 处的颜色
}, {
offset: 0.8,
color: "#FE951E" // 66% 处的颜色
}, {
offset: 0,
color: "#E75F25" // 50% 处的颜色
}], false) ],
[ 0.9, new echarts.graphic.LinearGradient(0, 0, 0, 1, [{
offset: 1,
color: "#C7DD6B" // 90% 处的颜色
}, {
offset: 0.8,
color: "#FEEC49" // 86% 处的颜色
}, {
offset: 0,
color: "#FFC539" // 70% 处的颜色
}], false) ],
[1, new echarts.graphic.LinearGradient(0, 0, 0, 1, [ {
offset: 0.2,
color: "#1CAD52" // 92% 处的颜色
}, {
offset: 0,
color: "#C7DD6B" // 90% 处的颜色
}], false) ]
],
width: 10
}
},
splitLine: {
show: false
},
axisTick: {
show: false
},
axisLabel: {
show: false
},
pointer : { //指针样式
length: '45%'
},
detail: {
show: false
}
}
]
}
setInterval(function () {
option.series[0].data[0].value = (Math.random() * 100).toFixed(2) - 0;
myChart.setOption(option, true);
},2000);
}
以上就是本文的全部内容,希望对大家的学习有所帮助,也希望大家多多支持。
以上是 swiper+echarts实现多个仪表盘左右滚动效果 的全部内容, 来源链接: utcz.com/p/220923.html