小程序实战(十六)带你从零到一 在小程序引入echarts
本文主要介绍从原生小程序如何引入echarts,文章末尾会给出原生小程序引入echarts的仓库地址和uniapp引入echarts的仓库地址。
第一步:引入echarts
正常情况下,例如在web端,直接做法是npm install echarts --save 。 不过在小程序中直接安装的话,会导致编译后代码包过大的问题,因此,我们可以使用echart的压缩版本,
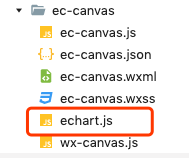
echart.min.js。将这个文件放在ec-canvas文件夹下。或者去文末的仓库地址去查看。
第二歩: 实现canvas组件
- ec-canvas.js
值得一提的是,一般绘制图表的数据都是服务器返回的,因此lazyLoad这个属性默认为true,意思为当拿到数据之后再进行图表的初始化。
我们会发现这个文件中引入一个WxCanvas,这是一个用于绘制canvas的封装工具。
// ec-canvas.jsimport WxCanvas from'./wx-canvas';
import * as echarts from'./echart';
let ctx;
Component({
properties: {
canvasId: {
type: String,
value: 'ec-canvas'
},
lazyLoad: {
type: Boolean,
value: false
},
disableTouch: {
type: Boolean,
value: false
},
throttleTouch: {
type: Boolean,
value: false
}
},
ready: function() {
if (!this.lazyLoad) this.init();
},
methods: {
init: function (callback) {
ctx = wx.createCanvasContext(this.data.canvasId, this);
const canvas = new WxCanvas(ctx, this.data.canvasId);
echarts.setCanvasCreator(() => {
return canvas;
});
var query = wx.createSelectorQuery().in(this);
query.select('.ec-canvas').boundingClientRect(res => {
if (typeof callback === 'function') {
this.chart = callback(canvas, res.width, res.height);
}
elseif (this.data.ec && typeofthis.data.ec.onInit === 'function') {
this.chart = this.data.ec.onInit(canvas, res.width, res.height);
}
else {
this.triggerEvent('onInit', {
canvas: canvas,
width: res.width,
height: res.height
});
}
}).exec();
},
canvasToTempFilePath(opt) {
if (!opt.canvasId) {
opt.canvasId = this.data.canvasId;
}
ctx.draw(true, () => {
wx.canvasToTempFilePath(opt, this);
});
},
touchStart(e) {
if (this.chart && e.touches.length > 0) {
var touch = e.touches[0];
var handler = this.chart.getZr().handler;
handler.dispatch('mousedown', {
zrX: touch.x,
zrY: touch.y
});
handler.dispatch('mousemove', {
zrX: touch.x,
zrY: touch.y
});
handler.processGesture(wrapTouch(e), 'start');
}
},
touchMove(e) {
if (this.chart && e.touches.length > 0) {
var touch = e.touches[0];
var handler = this.chart.getZr().handler;
handler.dispatch('mousemove', {
zrX: touch.x,
zrY: touch.y
});
handler.processGesture(wrapTouch(e), 'change');
}
},
touchEnd(e) {
if (this.chart) {
const touch = e.changedTouches ? e.changedTouches[0] : {};
var handler = this.chart.getZr().handler;
handler.dispatch('mouseup', {
zrX: touch.x,
zrY: touch.y
});
handler.dispatch('click', {
zrX: touch.x,
zrY: touch.y
});
handler.processGesture(wrapTouch(e), 'end');
}
}
}
})
// wx-canvas.jsexportdefaultclassWxCanvas{
constructor(ctx, canvasId) {
this.ctx = ctx;
this.canvasId = canvasId;
this.chart = null;
WxCanvas.initStyle(ctx);
this.initEvent();
}
getContext(contextType) {
return contextType === '2d' ? this.ctx : null;
}
setChart(chart) {
this.chart = chart;
}
attachEvent () {
// noop
}
detachEvent() {
// noop
}
static initStyle(ctx) {
const styles = [
'fillStyle',
'strokeStyle',
'globalAlpha',
'textAlign',
'textBaseAlign',
'shadow',
'lineWidth',
'lineCap',
'lineJoin',
'lineDash',
'miterLimit',
'fontSize'
]
styles.forEach((style) => {
Object.defineProperty(ctx, style, {
set: (value) => {
if ((style !== 'fillStyle' && style !== 'strokeStyle')
|| (value !== 'none' && value !== null)
) {
ctx[`set${style.charAt(0).toUpperCase()}${style.slice(1)}`](value);
}
},
});
});
ctx.createRadialGradient = () => ctx.createCircularGradient(arguments);
}
initEvent() {
this.event = {};
const eventNames = [{
wxName: 'touchStart',
ecName: 'mousedown',
}, {
wxName: 'touchMove',
ecName: 'mousemove',
}, {
wxName: 'touchEnd',
ecName: 'mouseup',
}, {
wxName: 'touchEnd',
ecName: 'click',
}];
eventNames.forEach((name) => {
this.event[name.wxName] = (e) => {
const touch = e.mp.touches[0];
this.chart._zr.handler.dispatch(name.ecName, {
zrX: name.wxName === 'tap' ? touch.clientX : touch.x,
zrY: name.wxName === 'tap' ? touch.clientY : touch.y,
});
};
});
}
}
- ec-canvas.wxml
<blockwx:if="{{ canvasId }}"><canvas
class="ec-canvas"
id="{{ canvasId }}"
canvasId="{{ canvasId }}"
bindtouchstart="touchStart"
bindtouchmove="touchMove"
bindtouchend="touchEnd"
binderror="error"
></canvas>
</block>
- ec-canvas.json 和 ec-canvas.wxss
{"component": true,
"usingComponents": {}
}
.ec-canvas {width: 100%;
height: 100%;
flex: 1;
}
第三歩:在页面中引入chart组件
- index.js
// index.jsimport * as echarts from'../../ec-canvas/echart';
Page({
data: {
},
onLoad: function () {
this.initChart()
},
// 初始化图表
initChart() {
const chartComponent = this.selectComponent('#chart')
chartComponent.init((canvas, width, height) => {
const chart = echarts.init(canvas, null, {
width,
height
})
const option = {
tooltip: {
trigger: 'axis',
axisPointer: {
type: 'shadow'
}
},
legend: {
orient: 'vertical',
x: 'right',
data: ['开单金额'],
textStyle: {
fontSize: 12,
color: '#999999'
}
},
grid: {
left: '2%',
right: '5%',
bottom: '5%',
top: "15%",
containLabel: true
},
color: ['#87E7FF'],
xAxis: {
type: 'category',
data: ['2020-07-18', '2020-07-19', '2020-07-20', '2020-07-21', '2020-07-22', '2020-07-23', '2020-07-24'],
axisLabel: {
textStyle: {
fontSize: 12,
color: '#999999'
}
},
axisTick: {
alignWithLabel: true
}
},
yAxis: {
type: 'value',
axisTick: {
inside: true
},
scale: true,
axisLabel: {
textStyle: {
fontSize: 12,
color: '#999999'
},
margin: 5,
formatter: function (value) {
if (value >= 1000) {
value = value / 1000 + "k";
}
return value;
}
}
},
series: [{
name: '金额',
stack: '-',
type: 'bar',
data: [ 572011, 2204, 44337, 62701, 106909, 44410, 146850],
value: [ 572011, 2204, 44337, 62701, 106909, 44410, 146850]
}]
};
chart.setOption(option)
return chart
})
}
})
- index.wxml
<viewclass="container"><viewclass="ec">
<ec-canvasid="chart"lazyLoad="{{ true }}"></ec-canvas>
</view>
</view>
最后一步
此时如果发现页面上并没有图表,控制台也没有任何的报错,那么就很有可能忘记了一个关键环节:为ec-canvas组件添加父级元素,并设置宽高。
.ec {margin-top: 40rpx;
width: 100%;
height: 400rpx;
}
Uniapp中引入echarts与原生很类似,实现的原理也相同。有需要的小伙伴可以去仓库里自取。
仓库地址:
原生小程序:github.com/zpf0918/ech…
uniapp: github.com/zpf0918/ech…
参考:www.jianshu.com/p/5537e5053…

<关于我们>
我们是来自帝都的一枚前端程序猿 + 一枚前端程序媛。
这里发布的文章是我们对学习内容的总结,预计会每周至少会更新一篇。
目前我们学习计划是:
小程序实战 => vue 进阶用法 => vue 原理 => css 基础 => es6 => js 深入
另外,工作中用到的一些技术和完成的功能,我们也会及时总结更新在这里
如文章有错误或表述不清晰,欢迎各位留言反馈~~
以上是 小程序实战(十六)带你从零到一 在小程序引入echarts 的全部内容, 来源链接: utcz.com/a/35209.html