Echarts气泡图
需求:
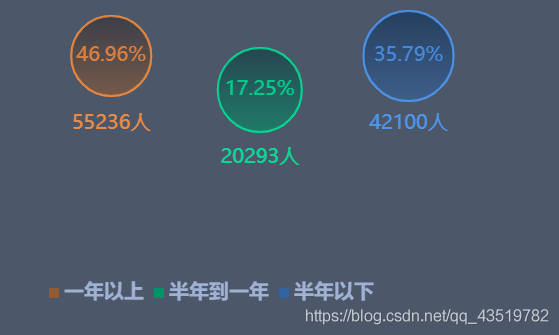
鼠标移入:
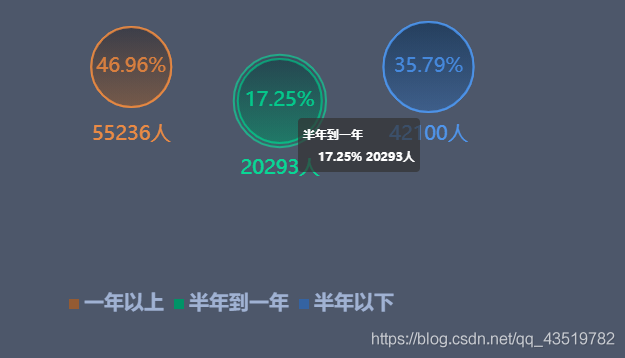
1、容器
<div id="syscBubleChart" style="width: 700px; height: 380px; background: rgba(2, 15, 43, 0.7)"></div>2、data中的数据
exportdefault{data(){
return{
plantCap:[
{
name:"2018",
value:"46.96",
num:"55236",
tip:"一年以上",
color:"#FF923F",
},
{
name:"2019",
value:"17.25",
num:"20293",
tip:"半年到一年",
color:"#00EA9C",
},
{
name:"2020",
value:"35.79",
num:"42100",
tip:"半年以下",
color:"#4F9EFD",
},
],
}
}
}
3、在methods中
methods:{initChart(){
let colors =["rgb(148, 91, 51)","rgb(0, 147, 103)","rgb(52, 99, 162)"];
// 计算数据总和 reduce
let result =this.plantCap.reduce(
(sum, e)=>Number(sum)+Number(e.value),
0
);
var datalist =[
{
offset:[10,80],
symbolSize:80,
opacity:0.5,
color:newecharts.graphic.LinearGradient(0,0,0,1,[
{
offset:0,
color:"rgb(46, 42, 50, .5)",
},
{
offset:1,
color:"rgb(148, 91, 51,.5)",
},
]),
},
{
offset:[38,70],
symbolSize:84,
opacity:0.5,
color:newecharts.graphic.LinearGradient(0,0,0,1,[
{
offset:0,
color:"rgb(10, 55, 61, .5)",
},
{
offset:1,
color:"rgb(0, 147, 103, .5)",
},
]),
},
{
offset:[66,80],
symbolSize:90,
opacity:0.5,
color:newecharts.graphic.LinearGradient(0,0,0,1,[
{
offset:0,
color:"rgb(8, 44, 84, .5)",
},
{
offset:1,
color:"rgb(52, 99, 162, .5)",
},
]),
},
];
var datas =[];
for(var i =0; i <this.plantCap.length; i++){
var item =this.plantCap[i];
var itemToStyle = datalist[i];
datas.push({
// name: item.name + "\n" + item.value,
name:
((item.value / result)*100).toFixed(2)+
"%"+
"\n"+
"\n"+
"\n"+
"\n"+
item.num +
"人",//气泡的百分比,
value: itemToStyle.offset,
symbolSize: itemToStyle.symbolSize,
label:{
normal:{
textStyle:{
fontSize:20,
lineHeight:17,
color: item.color,
padding:[68,0,0,0],
},
},
},
itemStyle:{
normal:{
color: itemToStyle.color,
opacity: itemToStyle.opacity,
borderWidth:"2",
borderColor: item.color,
borderType:"solid",
},
},
});
}
let option ={
// backgroundColor: "#20203e",
color: colors,
grid:{
show:false,
top:10,
bottom:10,
containLabel:true,
},
tooltip:{
trigger:"item",
// backgroundColor: "rgba(0,0,0,0.9)",
formatter:function(params){
let titleName;
if(params.dataIndex ==2){
titleName ="半年以下";
}elseif(params.dataIndex ==1){
titleName ="半年到一年";
}elseif(params.dataIndex ==0){
titleName ="一年以上";
}
return(
'<span>'+
titleName +
"</span>"+
// params.seriesName +
"<br/>"+
params.marker +
'<spantoken operator">+
params.color +
';font-size: 0.2rem;font-weight: bold;font-family: SourceHanSansCN;">'+
params.data["name"]+
"\n"+
"</span>"
);
},
},
legend:{
show:true,
left:85,
bottom:50,
trigger:"axis",
// 图例文字颜色
textStyle:{
fontSize:"20",
fontWeight:"bold",
fontFamily:"SourceHanSansCN",
color:"#A0B2D3",
},
icon:"rect",
itemWidth:10,
itemHeight:10,
},
xAxis:[
{
gridIndex:0,
type:"value",
show:false,
min:0,
max:100,
nameLocation:"middle",
nameGap:5,
},
],
yAxis:[
{
gridIndex:0,
min:0,
show:false,
max:100,
nameLocation:"middle",
nameGap:30,
},
],
series:[
{
name:"一年以上",
// color:'red',
type:"scatter",
symbol:"circle",
symbolSize:120,
label:{
normal:{
show:true,
formatter:"{b}",
color:"#fff",
textStyle:{
fontSize:"20",
fontFamily:"BoldCondensed",
},
},
},
dataLabels:{
allowOverlap:true,
},
data: datas,
},
{
name:"半年到一年",
// color:'red',
type:"scatter",
symbol:"circle",
symbolSize:120,
label:{
normal:{
show:true,
formatter:"{b}",
color:"#fff",
textStyle:{
fontSize:"20",
fontFamily:"BoldCondensed",
},
},
},
data: datas,
},
{
name:"半年以下",
type:"scatter",
symbol:"circle",
symbolSize:120,
label:{
normal:{
show:true,
formatter:"{b}",
color:"#fff",
textStyle:{
fontSize:"20",
fontFamily:"BoldCondensed",
},
},
},
data: datas,
},
],
};
let myChart =this.$echarts.init(document.getElementById("syscBubleChart"));
myChart.setOption(option);
window.addEventListener("resize",function(){
myChart.resize();
});
}
}
4、在mounted中调用
mounted(){this.initChart();
},
以上
以上是 Echarts气泡图 的全部内容, 来源链接: utcz.com/a/118232.html


