为什么pyecharts的geo使用timeline轮播部分内容显示不出来?
city=['南京市','苏州市','无锡市','南通市','淮安市','连云港市','镇江市','扬州市','泰州市','宿迁市','徐州市','常州市','盐城市']city_data=[1000,1003,800,900,432,100,909,876,100,50,31,980,2000]
data_pair=[list(z) for z in zip(city,city_data)]
tl= Timeline()# 创建 Timeline对象
for i in range(0,len(city)):
geo = Geo().add_schema(maptype='江苏')
geo.add('渠道积分',data_pair)
geo.set_series_opts(label_opts=opts.LabelOpts(is_show=True))
geo.set_global_opts(
visualmap_opts=opts.VisualMapOpts(), #设置legend显示的最大值
title_opts=opts.TitleOpts(title="全省业务量"), #左上角标题
)
tl.add(geo,data_pair[i][0].replace('市',''))
tl.add_schema(play_interval=1000, is_loop_play=True,is_auto_play=True)
components.html(tl.render_embed(), width=1700, height=700,scrolling=True)
为什么轮播框的部分地市显示不出来?比如苏州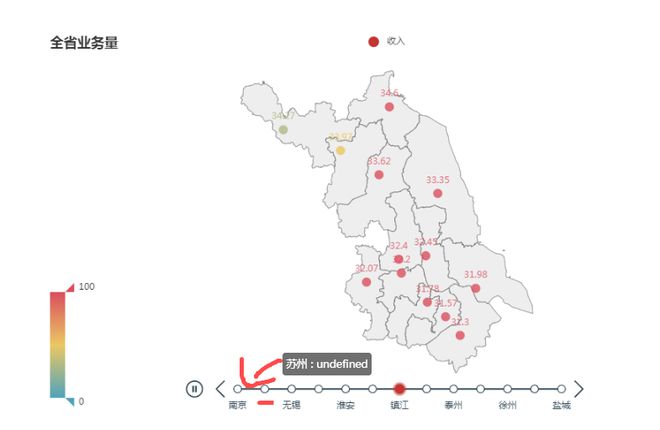
回答:
我笑了。。。
https://segmentfault.com/q/10... 同一个人。。。
以上是 为什么pyecharts的geo使用timeline轮播部分内容显示不出来? 的全部内容, 来源链接: utcz.com/p/938003.html