Android LineChart绘制多条曲线的方法
本文实例为大家分享了Android LineChart绘制多条曲线的具体代码,供大家参考,具体内容如下
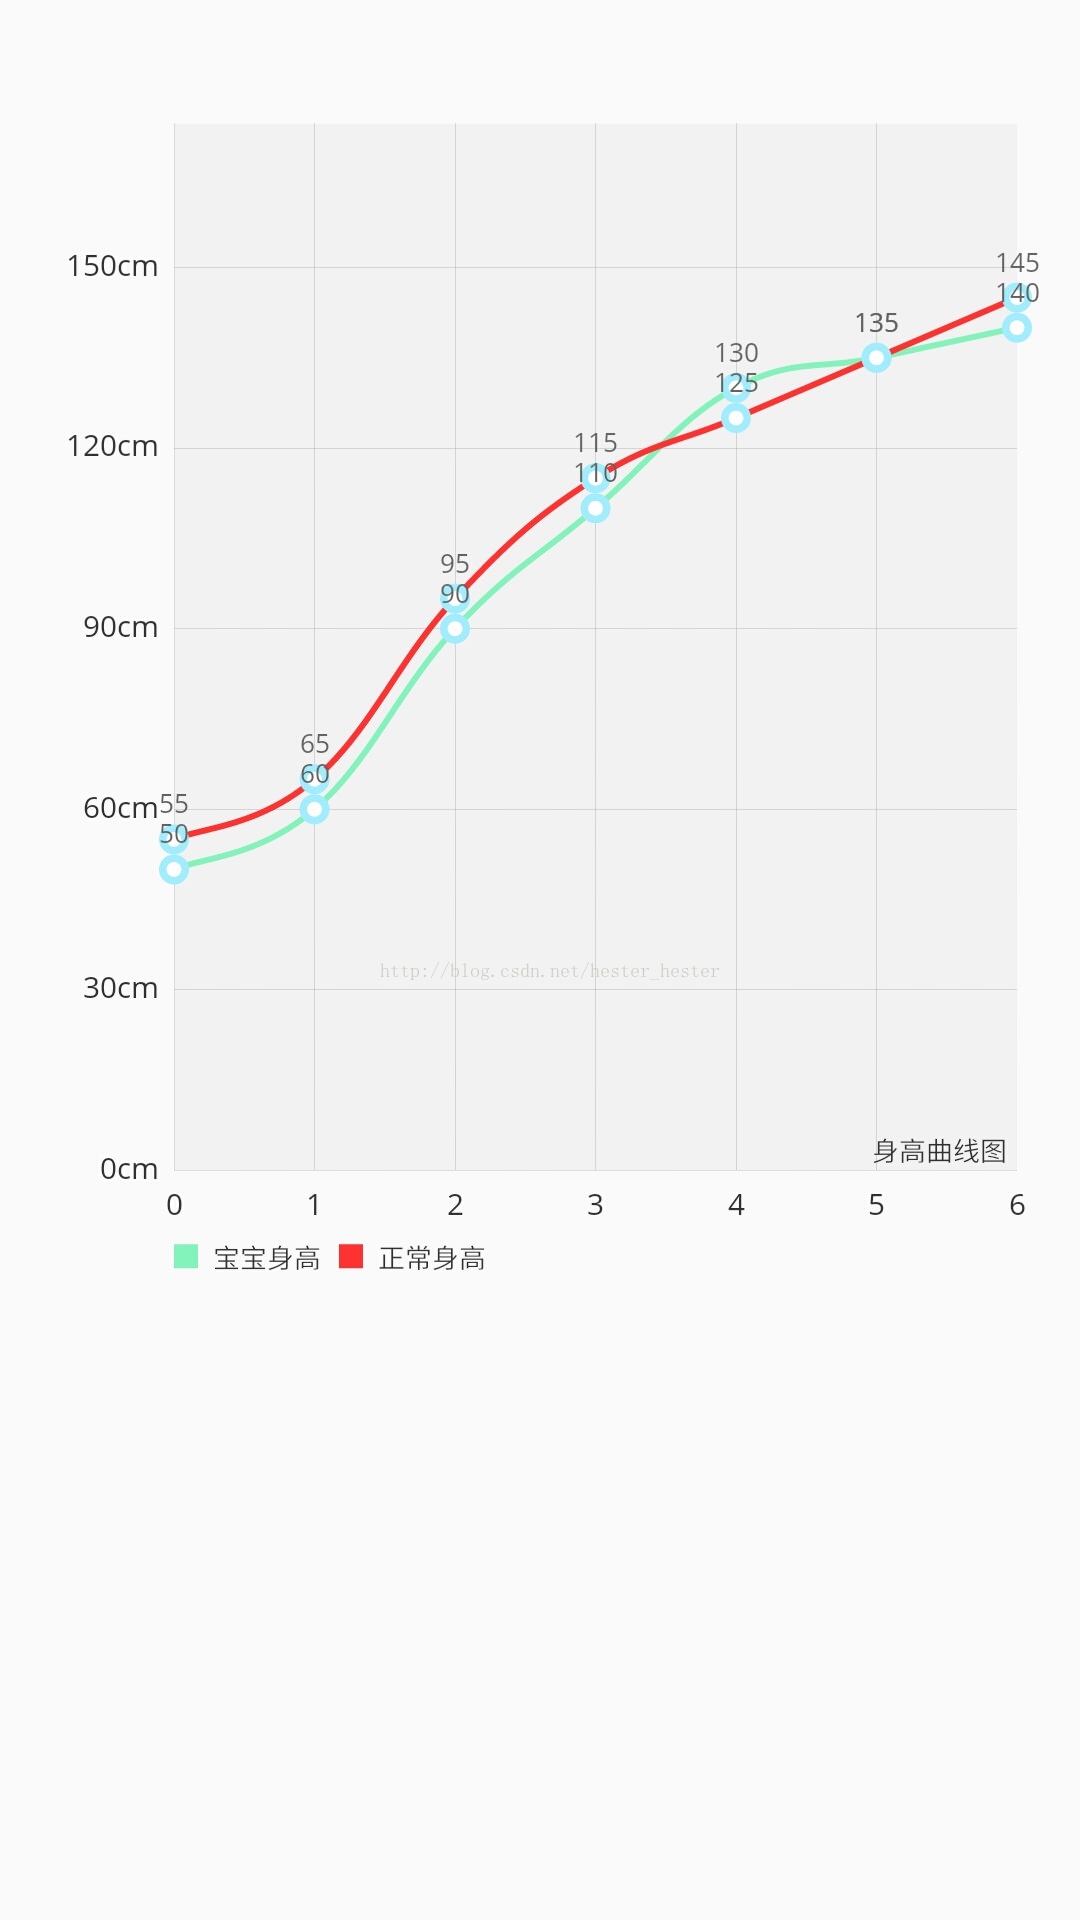
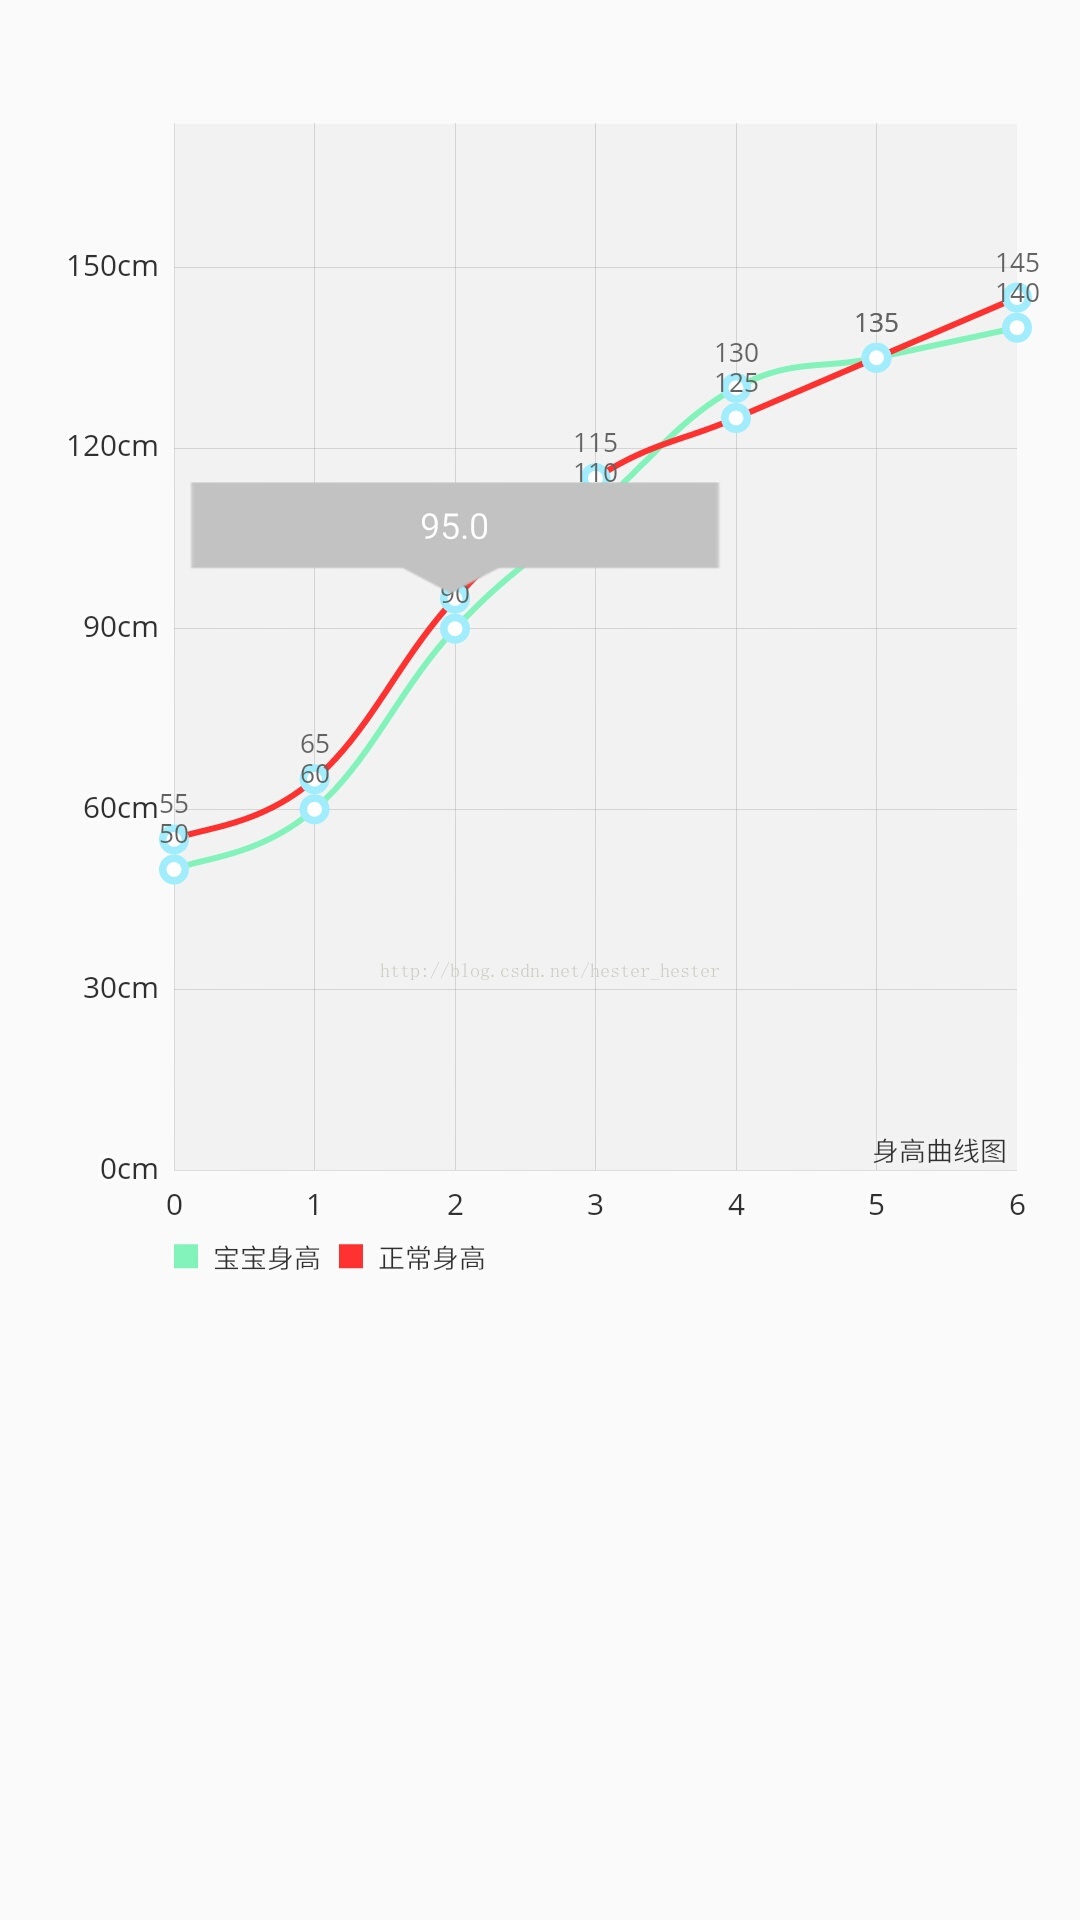
目标效果:
1.新建custom_marker_view.xml页面作为点击弹出框的页面:
<?xml version="1.0" encoding="utf-8"?>
<RelativeLayout xmlns:android="http://schemas.android.com/apk/res/android"
android:layout_width="wrap_content"
android:layout_height="40dp"
android:background="@drawable/marker2" >
<TextView
android:id="@+id/tvContent"
android:layout_width="wrap_content"
android:layout_height="wrap_content"
android:layout_centerHorizontal="true"
android:layout_marginTop="7dp"
android:layout_marginLeft="5dp"
android:layout_marginRight="5dp"
android:text=""
android:textSize="12dp"
android:textColor="@android:color/white"
android:ellipsize="end"
android:singleLine="true"
android:textAppearance="?android:attr/textAppearanceSmall" />
</RelativeLayout>
2.activity_main.xml页面:
<RelativeLayout xmlns:android="http://schemas.android.com/apk/res/android"
xmlns:tools="http://schemas.android.com/tools"
android:layout_width="match_parent"
android:layout_height="match_parent"
android:paddingBottom="10dp"
android:paddingLeft="10dp"
android:paddingRight="10dp"
android:paddingTop="10dp"
tools:context=".MainActivity" >
<com.github.mikephil.charting.charts.LineChart
android:id="@+id/chartTall"
android:layout_width="match_parent"
android:layout_height="400dp"
android:layout_marginTop="20dp" />
</RelativeLayout>
3.新建MyMarkerView.java重写MarkView控件:
package com.example.weixu.drawline;
import android.content.Context;
import android.widget.TextView;
import com.github.mikephil.charting.data.CandleEntry;
import com.github.mikephil.charting.data.Entry;
import com.github.mikephil.charting.utils.MarkerView;
import com.github.mikephil.charting.utils.Utils;
public class MyMarkerView extends MarkerView {
private TextView tvContent;
public MyMarkerView(Context context, int layoutResource) {
super(context, layoutResource);
tvContent = (TextView) findViewById(R.id.tvContent);
}
@Override
public void refreshContent(Entry e, int dataSetIndex) {
if (e instanceof CandleEntry) {
CandleEntry ce = (CandleEntry) e;
tvContent.setText("" + Utils.formatNumber(ce.getHigh(), 0, true));
} else {
tvContent.setText("" +e.getVal());
}
}
}
4.MainActivity.java页面:
package com.example.weixu.drawline;
import java.util.ArrayList;
import android.app.Activity;
import android.graphics.Color;
import android.graphics.Typeface;
import android.os.Bundle;
import android.view.WindowManager;
import com.github.mikephil.charting.charts.BarLineChartBase;
import com.github.mikephil.charting.charts.BarLineChartBase.BorderPosition;
import com.github.mikephil.charting.charts.LineChart;
import com.github.mikephil.charting.data.Entry;
import com.github.mikephil.charting.data.LineData;
import com.github.mikephil.charting.data.LineDataSet;
import com.github.mikephil.charting.utils.Legend;
import com.github.mikephil.charting.utils.Legend.LegendForm;
import com.github.mikephil.charting.utils.XLabels;
import com.github.mikephil.charting.utils.XLabels.XLabelPosition;
import com.github.mikephil.charting.utils.YLabels;
public class MainActivity extends Activity {
private LineChart chartTall;
@Override
protected void onCreate(Bundle savedInstanceState) {
super.onCreate(savedInstanceState);
getWindow().setFlags(WindowManager.LayoutParams.FLAG_FULLSCREEN,
WindowManager.LayoutParams.FLAG_FULLSCREEN);
setContentView(R.layout.activity_main);
chartTall = (LineChart) findViewById(R.id.chartTall);
setType();
// 刷新图表
chartTall.invalidate();
}
private void setType() {
// 设置在Y轴上是否是从0开始显示
chartTall.setStartAtZero(true);
//是否在Y轴显示数据,就是曲线上的数据
chartTall.setDrawYValues(true);
//设置网格
chartTall.setDrawBorder(true);
chartTall.setBorderPositions(new BarLineChartBase.BorderPosition[] {
BorderPosition.BOTTOM});
//在chart上的右下角加描述
chartTall.setDescription("身高曲线图");
//设置Y轴上的单位
chartTall.setUnit("cm");
//设置透明度
chartTall.setAlpha(0.8f);
//设置网格底下的那条线的颜色
chartTall.setBorderColor(Color.rgb(213, 216, 214));
//设置Y轴前后倒置
chartTall.setInvertYAxisEnabled(false);
//设置高亮显示
chartTall.setHighlightEnabled(true);
//设置是否可以触摸,如为false,则不能拖动,缩放等
chartTall.setTouchEnabled(true);
//设置是否可以拖拽,缩放
chartTall.setDragEnabled(true);
chartTall.setScaleEnabled(true);
//设置是否能扩大扩小
chartTall.setPinchZoom(true);
//设置点击chart图对应的数据弹出标注
MyMarkerView mv = new MyMarkerView(this, R.layout.custom_marker_view);
mv.setOffsets(-mv.getMeasuredWidth() / 2, -mv.getMeasuredHeight());
chartTall.setMarkerView(mv);
chartTall.setHighlightIndicatorEnabled(false);
//设置字体格式,如正楷
Typeface tf = Typeface.createFromAsset(getAssets(),
"OpenSans-Regular.ttf");
chartTall.setValueTypeface(tf);
XLabels xl = chartTall.getXLabels();
xl.setPosition(XLabelPosition.BOTTOM); // 设置X轴的数据在底部显示
xl.setTypeface(tf); // 设置字体
xl.setTextSize(10f); // 设置字体大小
xl.setSpaceBetweenLabels(3); // 设置数据之间的间距
YLabels yl = chartTall.getYLabels();
yl.setTypeface(tf); // 设置字体
yl.setTextSize(10f); // s设置字体大小
yl.setLabelCount(5); // 设置Y轴最多显示的数据个数
// 加载数据
setData();
//从X轴进入的动画
chartTall.animateX(4000);
chartTall.animateY(3000); //从Y轴进入的动画
chartTall.animateXY(3000, 3000); //从XY轴一起进入的动画
//设置最小的缩放
chartTall.setScaleMinima(0.5f, 1f);
}
private void setData() {
String[] babAge = {"0","1","2","3","4","5","6"}; //连线的x轴数据
String[] babyTall = {"50","60","90","110","130","135","140"};
String[] usuaTall = {"55","65","95","115","125","135","145"};//连线的y轴数据
LineData data=new LineData(babAge,setLine(babAge,babyTall,1,"宝宝身高")); //创建LineData实体类并添加第一条曲线
data.addDataSet(setLine(babAge,usuaTall,2,"正常身高")); //添加第二条曲线
chartTall.setData(data);
}
//画线
private LineDataSet setLine(String[] babAge, String[] Tall,int flag,String name) {
ArrayList<String> xValsAge = new ArrayList<String>();
for (int i = 0; i < babAge.length; i++) {
xValsAge.add(babAge[i]);
}
ArrayList<Entry> yValsBabyTall = new ArrayList<Entry>();
for (int i = 0; i < Tall.length; i++) {
yValsBabyTall.add(new Entry(Float.parseFloat(Tall[i]), i));
}
//设置baby的成长曲线
LineDataSet setData = new LineDataSet(yValsBabyTall,name);
setData.setDrawCubic(true); //设置曲线为圆滑的线
setData.setCubicIntensity(0.2f);
setData.setDrawFilled(false); //设置包括的范围区域填充颜色
setData.setDrawCircles(true); //设置有圆点
setData.setLineWidth(2f); //设置线的宽度
setData.setCircleSize(5f); //设置小圆的大小
setData.setHighLightColor(Color.rgb(244, 117, 117));
//设置曲线颜色
if(flag==1)
setData.setColor(Color.rgb(104, 241, 175)); //宝宝身高曲线颜色
else if(flag==2)
setData.setColor(Color.rgb(255, 0, 0)); //普通身高曲线颜色
return setData; //返回曲线
}
}
源码:点击打开链接
以上就是本文的全部内容,希望对大家的学习有所帮助,也希望大家多多支持。
以上是 Android LineChart绘制多条曲线的方法 的全部内容, 来源链接: utcz.com/p/241872.html