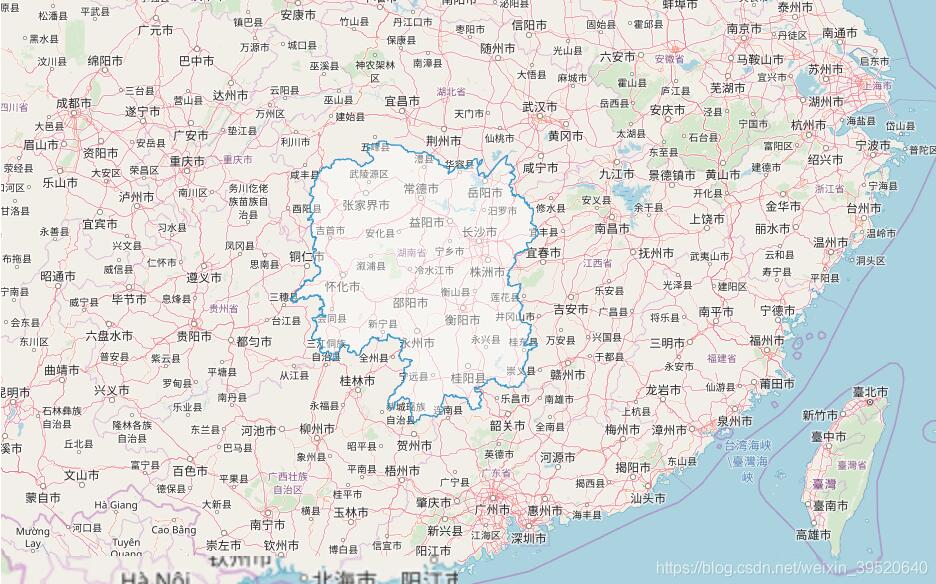
vue+openlayers绘制省市边界线
本文实例为大家分享了vue+openlayers绘制省市边界线的具体代码,供大家参考,具体内容如下
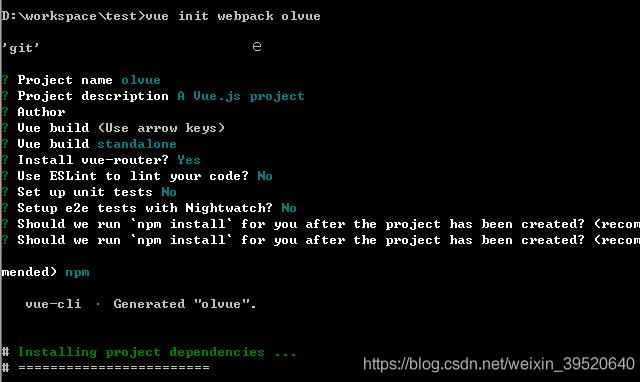
1、创建项目
vue init webpack ol_vue
2、安装ol依赖包
npm install ol
3、引入axios
npm install axios --save
文件目录:src/main.js
import Vue from 'vue'
import router from './router'
import App from './App'
import axios from "axios";
//添加实例属性:不想污染全局作用域,在原型上定义它们使其在每个 Vue 的实例中可用。prototype向对象添加属性和方法。
// $ 是在 Vue 所有实例中都可用的属性的一个简单约定。
Vue.prototype.$axios = axios
//阻止启动生产消息。
Vue.config.productionTip = false
//开启debug模式
//Vue.config.debug = true
//禁用ESLint进行检测
/* eslint-disable no-new */
new Vue({
el: '#app',
router,
components: { App },
template: '<App/>'
})
4、api
文件目录:static/js/api.js
const host = 'https://api.obtdata.com/';
export default {
'searchcity': host + 'standard/searchcity'
}
5、实现代码
<template>
<div>
<div id="map"></div>
</div>
</template>
<script>
import Map from 'ol/Map'
import View from 'ol/View'
import TileLayer from 'ol/layer/Tile'
import GeoJSON from 'ol/format/geoJson'
import Feature from 'ol/Feature'
import vectorLayer from 'ol/layer/Vector'
import SourceVector from 'ol/source/Vector'
import {Style,Stroke} from 'ol/style'
import OSM from 'ol/source/OSM'
import {fromLonLat} from 'ol/proj.js'
import api from '../static/js/api'
export default {
name: "app",
data () {
return {
map: null,
source:null,
resData:null,
vector: null
}
},
mounted () {
//ol.source.Vector,提供矢量图层数据
var source = new SourceVector({
wrapX: false,
code: 'EPSG:4326',
});
//ol.layer.Vector用于显示在客户端渲染的矢量数据。
this.vector = new vectorLayer({
source: source,
});
this.map = new Map({
target: 'map',
layers: [
new TileLayer({
source: new OSM()
}),
this.vector
],
view: new View({
center: fromLonLat([110.850881285943,30.1253920380122]),//湖南省
zoom: 5
})
});
this.searchCity()
},
methods:{
searchCity() {
//axios获取数据
this.$axios
.get(api.searchcity, {
params: {
code: '43'
}
})
.then((res) => {
this.resData = res.data.geom;
//console.log(this.resData)
//ol.format.GeoJSON:以GeoJSON格式读取和写入数据
//readGeometry (source,opt_options)阅读几何图形
//dataProjection投影我们正在阅读的数据
//featureProjection投影格式阅读器创建的要素几何
var geom=(new GeoJSON()).readGeometry(this.resData,{
dataProjection:'EPSG:4326',
featureProjection:'EPSG:3857'
});
//ol.Feature具有几何和其他属性属性的地理要素的矢量对象
var feature=new Feature(geom);
//ol.source.Vector提供矢量图层的要素源
//features特征。如果提供为module:ol/Collection,则源和集合中的功能将保持同步。
//wrapX水平包裹世界。对于横跨-180°和180°子午线的矢量编辑以正常工作,应将其设置为false。
var source=new SourceVector({
features:[feature],
wrapX:false
});
//getFeatures以随机顺序获取源上的所有功能。
//getGeometry获取要素的默认几何体。
var polygons=(source.getFeatures()[0].getGeometry());
var size=(this.map.getSize());
//addFeature向源添加单个功能。
this.vector.getSource().addFeature(feature);
//fit(geometryOrExtent,opt_options)根据给定的地图大小和边框拟合给定的几何或范围。
this.map.getView().fit(polygons,size);
})
}
}
}
</script>
<style scoped>
</style>
以上就是本文的全部内容,希望对大家的学习有所帮助,也希望大家多多支持。
以上是 vue+openlayers绘制省市边界线 的全部内容, 来源链接: utcz.com/p/238747.html