vue中echarts的用法及与elementui-select的协同绑定操作
1.vue中echarts的使用
引入echarts后
let myChart = echarts.init(document.getElementById('dsm'));//dsm为绑定的dom结构
var option = {
//backgroundColor:"#111c4e",
tooltip: {
trigger: 'axis'
},
legend: { //图表上方的图例显隐
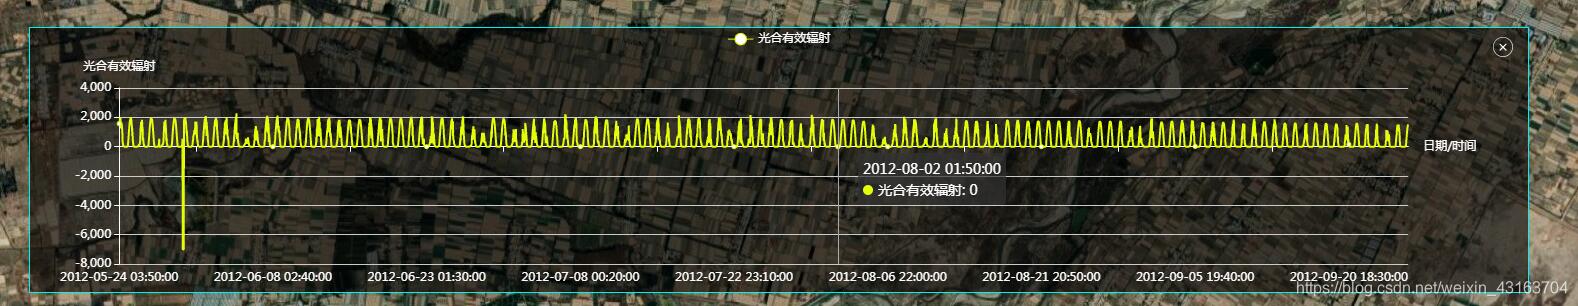
data:['光合有效辐射'],
textStyle: {
color: '#fff'
}
},
color:['#E4FD0A'],
grid: { //图表里上下左右的空间 间隙
left: '3%',
right: '8%',
bottom: '3%',
containLabel: true
},
xAxis: { //x轴属性
type: 'category',
name: '日期/时间',
// boundaryGap: false,
data: this.xZhou,
axisLine:{
lineStyle:{color:'#fff'} // x轴坐标轴颜色
},
axisLabel: {
show: true,
color: '#fff',
fontSize:12,
// rotate: 30
}
},
yAxis: { //y轴属性
type: 'value',
name: '光合有效辐射',
axisLine:{
lineStyle:{color:'#fff'} // x轴坐标轴颜色
},
axisLabel: {
show: true,
color: '#fff',
fontSize:12,
// rotate: 30
}
},
series: [ //为鼠标在图表中划过时显示的数据
{
name:'光合有效辐射',
type:'line',
stack: '总量',
data:this.yZhou,
lineStyle:{
normal:{
color: '#E4FD0A'
}
}
}
]
};
myChart.setOption(option)
window.addEventListener("resize", function () { //设置图表因窗口大小的变化进行变化
myChart.resize();
});
上述图表的显示效果为:
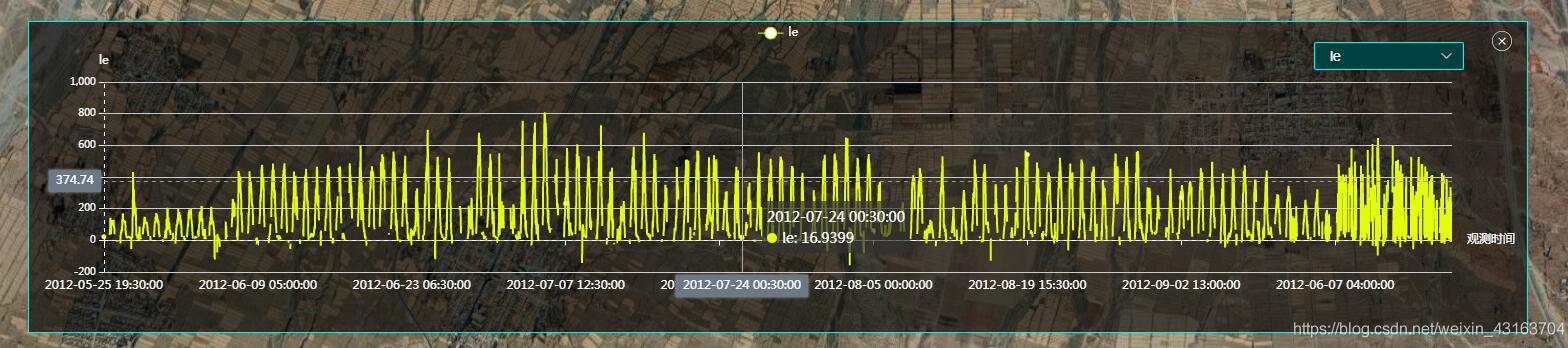
2.echarts与elementui-select的协同绑定
实现依据elementui-select的变化而变化图表。
<template>
<div class="content">
<div class="contentDetail" v-show="isXM">
<div class="close" @click="close"></div>
<div class="chartContent">
<el-select
v-model="defaultyAxis" //利用v-model对默认数据defaultyAxis进行改变,实际绑定的数据是yAxisOption
placeholder="请选择"
class="chartSelect"
popper-class="trsfChartSelect-popper"
@change="renderChart()"
>
<el-option v-for="item in yAxisOption" :key="item" :label="item" :value="item"></el-option>
</el-select>
<div id="zsfChart"></div>
</div>
</div>
</div>
</template>
<script>
import { zsfEntity} from '@/api/sfcl.js'
export default {
name: 'Home',
data() {
return {
isXM: true,
yAxisOption: ['a', 'b'],
defaultyAxis: '',
dataOgj: {},
}
},
mounted() {
this.$comjs.addSimplePoint([100.62713539843939, 38.620863795306164]) //cesium挂载图标
this.getChartDataAndRender()
},
methods: {
close() {
this.isXM = false
this.$store.commit('getComponent1', '')
},
getChartDataAndRender(){ //axios获取异步数据
var _this = this
zsfEntity().then(res => {
if(res.obj.length == 0){
return
}
let keyArr = Object.keys(res.obj[0])
for (let item of keyArr) {
_this.dataOgj[item] = []
}
for (let item of res.obj) {
for (let item1 of keyArr) {
_this.dataOgj[item1].push(item[item1])
}
}
_this.yAxisOption = keyArr.slice(1)//y轴实际数据 四项
_this.defaultyAxis = _this.yAxisOption[0] //获取y轴默认数据
_this.renderChart()
})
},
//渲染图表
renderChart() {
let myChart = echarts.init(document.getElementById('zsfChart'))
let option = {
tooltip: {
trigger: 'axis',
axisPointer: {
type: 'cross',
label: {
backgroundColor: '#6a7985'
}
}
},
legend: {
data:[this.defaultyAxis],
textStyle: {
color: '#fff'
}
},
grid: {
right: '5%',
left: '5%'
},
color: ['#E4FD0A'],
xAxis: {
name: "观测时间",
type: 'category',
boundaryGap: false,
data: this.dataOgj.observeTime,
axisLabel: {
color: '#ffffff'
// fontSize: 10,
// rotate:30
},
axisLine: {
lineStyle: {
color: '#ffffff',
type: 'dashed'
}
}
},
yAxis: {
name: this.defaultyAxis,//挂载默认数据
type: 'value',
axisLabel: {
color: '#ffffff',
fontSize: 10
// rotate:30
},
axisLine: {
lineStyle: {
color: '#ffffff',
type: 'dashed'
}
}
},
series: [
{
data: this.dataOgj[this.defaultyAxis],
type: 'line',
name: this.defaultyAxis
}
]
}
myChart.setOption(option)
window.addEventListener('resize', function() {
myChart.resize()
})
}
},
destroyed(){
this.$comjs.removeSimplePoint()
}
}
</script>
<style lang="stylus">
.trsfChartSelect-popper
background: rgba(1,64,64,1)
.el-select-dropdown__item.hover, .el-select-dropdown__item:hover
background: rgba(0,0,0,0.5)
.el-select-dropdown__item
color: #fff
</style>
<style lang="stylus" scoped>
@import '../../assets/styles/varibles.styl'
.content
position: absolute
right: vw(10)
top:vh(71)
z-index: 100
color: #fff
background: $bgColor
.contentDetail
width:vw(1500)
height:vh(348)
position: fixed
right: 70px
bottom: 27px
margin:auto
z-index: 100
color: #fff
background: $bgColor
border: 1px solid rgba(3,240,240,1)
.close
position:absolute
right:vw(15)
top:vh(10)
cursor: pointer
background-image:url("/images/lanhu/close.png")
width: 20px;
height: 20px;
z-index: 1
.baseInfo
height: 75px;
padding-top: 30px;
.baseInfo-item
width: 33%;
display: inline-block;
text-align: left;
margin-bottom: 20px;
padding-left: 80px;
.baseInfo-item-icon
vertical-align: middle
margin-right: 14px
.baseInfo-item-text
vertical-align: middle
.separator
height: 1px
background: #03F0F0
.chartContent
height: 100%
.chartSelect
position:absolute
right: 63px
margin-top: 20px
width: 150px
z-index: 1
/deep/ .el-input__inner
height: 28px;
line-height: 28px;
background:rgba(1,64,64,1);
border-radius:2px;
border:1px solid rgba(0,252,252,1);
color: #fff
/deep/ .el-input__icon
line-height: 28px;
#zsfChart
height: 100%
width:100%
</style>
效果实现

补充知识:vue项目在同一页面中引入多个echarts图表 ,并实现封装,自适应和动态数据改变
vue-Echarts
公司最近做项目需要用到图表,以前是使用echarts,现在也是用这个,没什么好纠结的! 但是最近发现以前每次做图表之类的都没有封装,每次做图表都要从新去配置之类的,写了好多重复代码,感觉很累啊,所以自己把图表封装成子组件使用,代码工作量减轻了很多,而且子组件使用了数据进行监听和图表自适应屏幕大小,这样以后会方便很多了!
当然公司的项目肯定不能发出来了,我会做个简单的demo出来
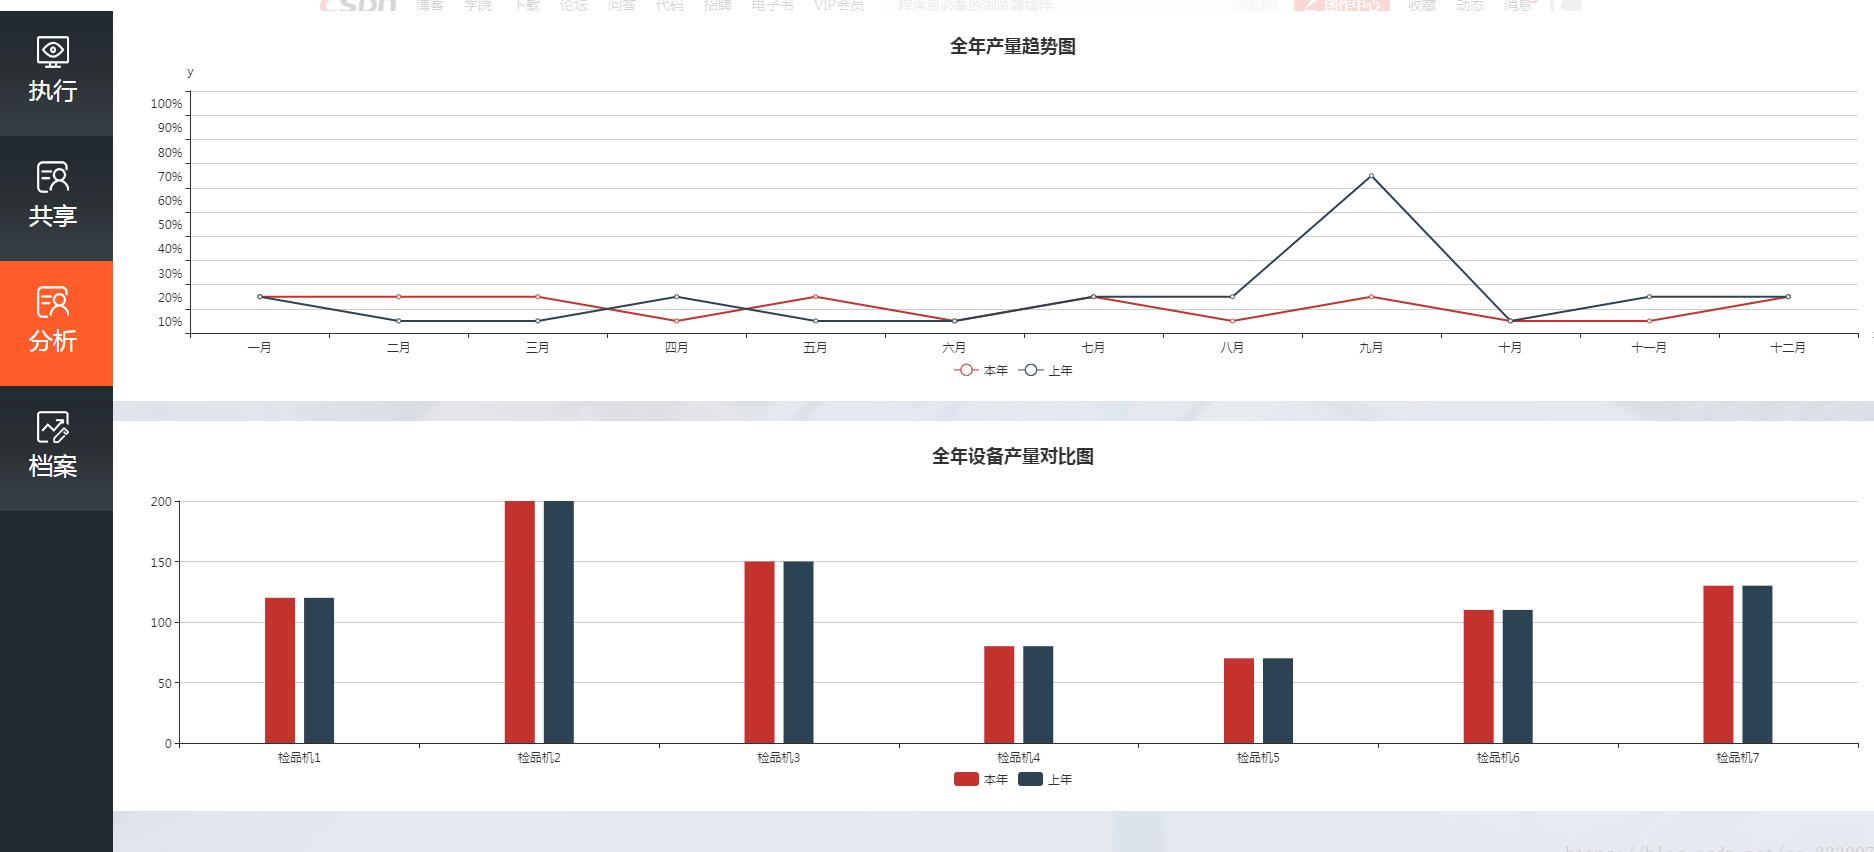
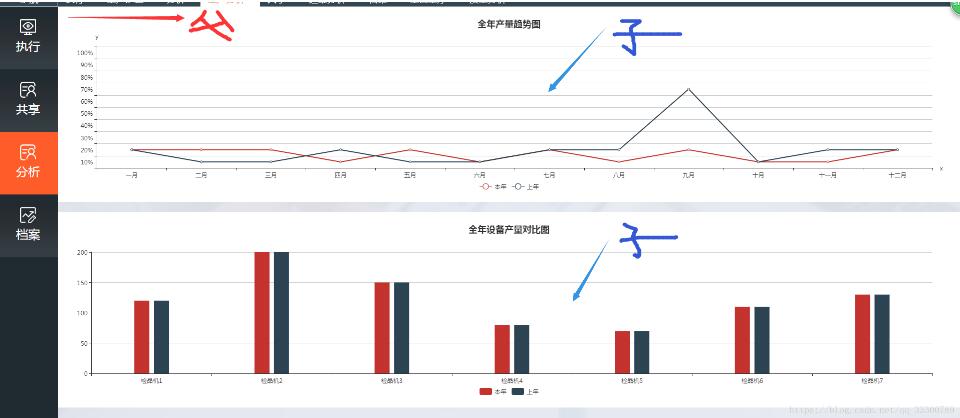
先截个图吧!
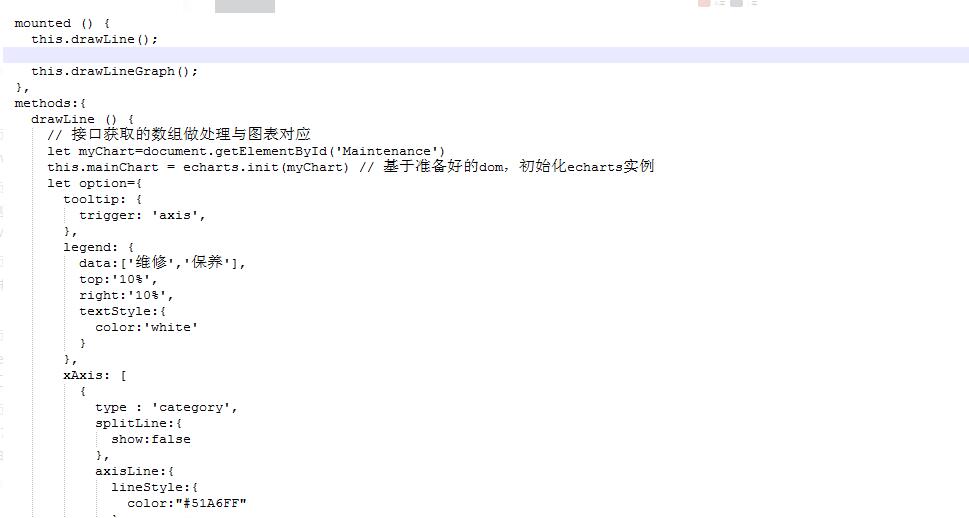
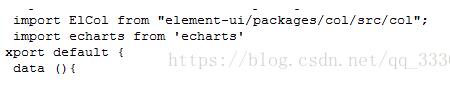
其实我也未作什么太复杂的工作,以前工作中,页面中要2个图表,我在methods:{}中写两个方法配置之类的,类似这样子:
好了,首先第一步,使用echarts当然要引用了
1. vue 项目中 引用echarts
cnpm install echarts -S
执行完毕后再 main.js中引入
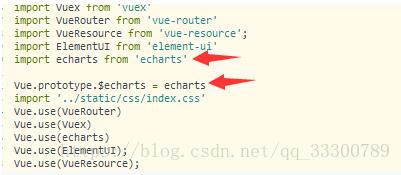
因为是pc端的项目,用了element ui (不重要),引入之后就可以在全局使用了,之前对这个不是很懂,每个要图表页面都引入echarts,就像这个样子:
使代码写的乱七八糟的,现在在全局引用了,就不需要在每个用图表的页面中引入了
2. 父子组件中使用图表,现在我做的这个页面把他分成两个部分,这个页面整体为父,两个图表为子组件,这样子
1.先看下父组件代码,样式类的请忽视

import linegraph from '@/components/linegraph.vue'
export default {
data(){
return{
notAccess:false,
ChartLineGraph2:null,
option:{
title: {
text: '全年产量趋势图',
left: 'center'
},
tooltip: {
trigger: 'item',
formatter: '{a} <br/>{b} : {c}'
},
legend: {
left: 'center',
data: ['本年', '上年'],
bottom:0
},
xAxis: {
type: 'category',
name: 'x',
splitLine: {show: false},
data: ['一月', '二月', '三月', '四月', '五月', '六月', '七月', '八月', '九月', '十月', '十一月', '十二月']
},
grid: {
left: '1%',
right: '2%',
bottom: '8%',
containLabel: true
},
yAxis: {
type: 'category',
name: 'y',
splitLine: {show: true},
data:['10%','20%','30%','40%','50%','60%','70%','80%','90%','100%']
},
series: [
{
name: '本年',
type: 'line',
data: [0.8, 0.98, 0.96, 0.27, 0.81, 0.47, 0.74, 0.23, .69, 0.25, 0.36, 0.56]
},
{
name: '上年',
type: 'line',
data: [1, 0.2, 0.4, 0.8, 0.16, 0.32, 0.64, 1.28, 5.6, 0.25, 0.63, 0.65, 0.12]
},
]
},
option2:{
title: {
text: '全年设备产量对比图',
left: 'center'
},
xAxis: {
type: 'category',
data: ['检品机1', '检品机2', '检品机3', '检品机4', '检品机5', '检品机6', '检品机7']
},
yAxis: {
type: 'value'
},
legend: {
left: 'center',
data: ['本年', '上年'],
bottom:0
},
grid: {
left: '1%',
right: '2%',
bottom: '8%',
containLabel: true
},
series: [
{
name: '本年',
data: [120, 200, 150, 80, 70, 110, 130],
type: 'bar',
barWidth:30,
},
{
name: '上年',
data: [120, 200, 150, 80, 70, 110, 130],
type: 'bar',
barWidth:30,
}]
}
}
},
mounted(){
},
components:{
ErrorTip,
linegraph,
}
}
这是父组件代码,两个图表不管是折线图还是柱状图都是使用 linegraph.vue这个子组件来进行的,因为我把echarts图表生成的配置项都放在了父组件里面,然后通过父组件给子组件传值实现图表生成,
3.父组件我们看完了,现在我们看下是如何封装的图表类linegraph.vue子组件,我先截图一下,然后解释:
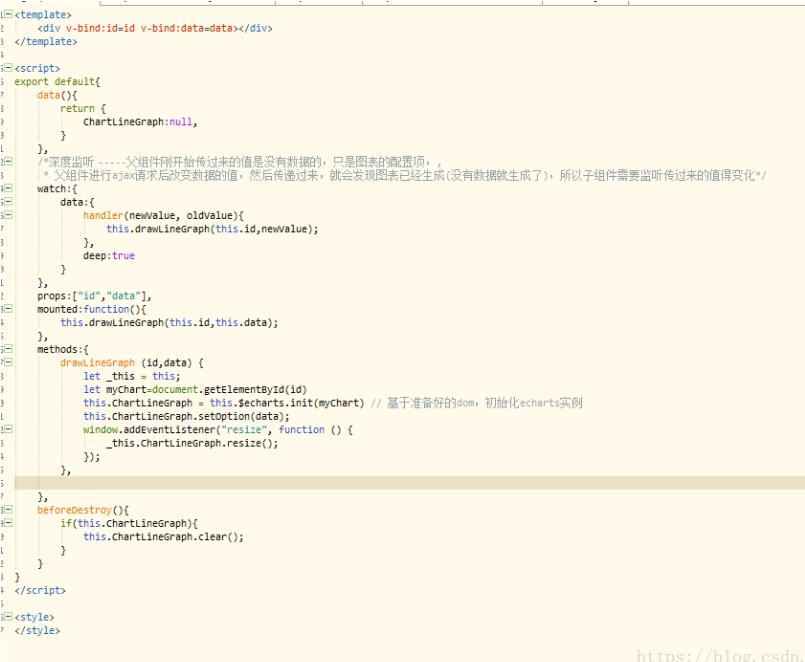
这里需要注意一下这几个问题,
第一个: 父子组件传值问题 ,父组件需要传id值和配置项的值给子组件生成图表,通过vue的prop传过来的id和data(配置项) ,具体怎么传值可看父子组件传值代码或百度;
第二点: 我们首先设想这样一个场景: 当父组件的传值 option或者option2 (图表配置项),刚开始在data()里面是设置为option:null,或者是一个空的对象,或者配置项缺少数据这部分,在methods中通过ajax调用接口获取到数据然后赋值给option,例如:this.option = 一个对象,可以成图表之类的,当option值未改变时就把option=null的值传递给了子组件,这样图表生成不了,像这样


数据不能动态传值 ,数据不能动态传值! 要解决这个问题,必须用到vue watch的对象深度监听,我之前写了一篇watch,正好用上了
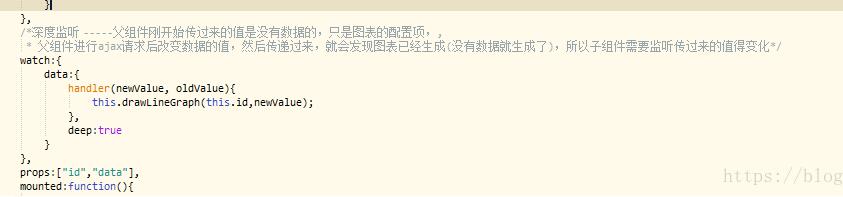
对子组件接受到的data(配置项)进行深度监听,当父组件通过ajax改变了传过来的data的值,图表将会重新渲染。
3.第三个问题
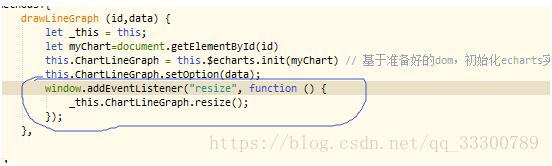
图表自适应,当屏幕大小改变时,图表也需要进行自适应,本来挺简单的东西,被我头脑转不过来,搞了一个小时,总算搞好了啊,其实之前写的就是在 子组件的 drawLineGraph()方法里面写入一个方法,这个方法
window.onresize =this.ChartLineGraph.resize;
还是出问题了,这个页面两个图表,结果只有后面的图表会自适应,前面的那个没反应???,我就蒙了,还以为自己方法写错了,真是蛋疼, 改成这样,那个this一定要注意,我就是搞错对象了,然后两个图表都可以自适应
好吧,这是我封装的echarts组件,没有进行ajax的对接操作,如果有问题,欢迎留言!
以上这篇vue中echarts的用法及与elementui-select的协同绑定操作就是小编分享给大家的全部内容了,希望能给大家一个参考,也希望大家多多支持。
以上是 vue中echarts的用法及与elementui-select的协同绑定操作 的全部内容, 来源链接: utcz.com/p/218800.html