ECharts 怎么根据数据实现图表自增
1.ECharts 怎么根据数据实现图表自增,譬如我这里有2条数据,我对应要增加2个仪表图怎么实现?
2.这是代码,需要用到的是c3text和c4text分别设置仪表盘的刻度: ][1]
][1]
3.这是代码:
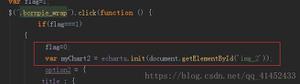
var rounds = document.querySelector('div.round');
var _watchHtml = '';//this._valueDatas 数据数组
this._valueDatas.forEach(function (value,index,array) {
//格式化获取到的图片中的对象数组
value = eval('('+ value +')');
//数组长度
console.log(array.length)
_watchHtml += '<div class="watchBox"><div class="watch"></div></div>'
rounds.innerHTML = _watchHtml;
//仪表盘配置参数
var watch = echarts.init(document.querySelector(".watch"));
var option = {
tooltip: {
formatter: "{a} <br/>{b} : {c}%"
},
textStyle: {
fontSize: 8,
},
series: [
{
name: '业务指标',
type: 'gauge',
radius: '100%',
splitNumber: 6,
center: [119, 110],
min: 0,
max: 60,
detail: {
formatter: '{value}min',
fontSize: 10,
offsetCenter: ['0%', '60%']
},
data: [{value: 30}],
axisLine: {
lineStyle: {
color: [
[0.165, '#91c7ae'],
[0.33, '#FF33CC'],
[0.5, '#9966CC'],
[0.67, '#FF6600'],
[0.83, '#6633CC'],
[1, '#c23531']
]
}
},
axisLabel: {
distance: 5,
fontSize: 10,
},
pointer: {
show: true,
length: '60%',
width: 5,
}
}
]
}
watch.setOption(option);
setInterval(function () {
option.series[0].data[0].value = (Math.random() * 60).toFixed(2) - 0;
watch.setOption(option, true);
}, 2000);
})
回答:
实现了,要在里面二次拼接,实现代码如下:
//TAT
var rounds = document.querySelector('div.round');var _watchHtml = '';
this._valueDatas.forEach(function (value,index,array) {
value = eval('('+ value +')');
console.log(value)
var maxTat = value.c3text; //总值 100
var fwcTat = value.c4text; //警报值 60
var difTat = (maxTat - fwcTat); //安全值 100-60 = 40
var colors = difTat/100;
var _valueLengths = value.c3text.length;
_watchHtml += '<div class="watchBox"><div class="watch w'+index+'"></div></div>'
var wat=document.createElement('div');
wat.setAttribute('class','watchBox');
wat.innerHTML='<div class="watch w'+index+'"></div>';
// rounds.innerHTML = _watchHtml;
rounds.appendChild(wat)
//仪表盘配置参数
var watch = echarts.init(document.querySelector('.w'+index));
})
回答:
实现什么?啥都没看到?
以上是 ECharts 怎么根据数据实现图表自增 的全部内容, 来源链接: utcz.com/a/160157.html