vue+ECharts实现折线图和饼图代码示例
在开发后台管理项目时,需要统计后台用户数据,以折线图和饼图的形式显示,这边采用apache-echarts来实现需求。
1.安装echarts和引入
npm install echarts --saveimport * as echarts from 'echarts';
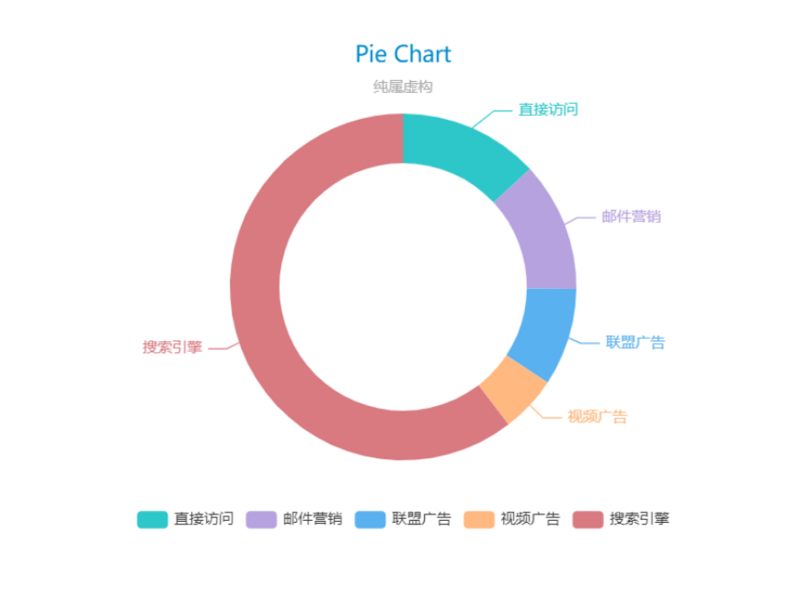
2.使用echarts实现pie图
<template> <div id="chartPie" class="pie-wrap"></div>
</template>
<script>
import * as echarts from 'echarts';
require('echarts/theme/macarons');//引入主题
export default {
data() {
return {
chartPie: null
}
},
mounted() {
this.$nextTick(() => {
this.drawPieChart();
})
},
methods: {
drawPieChart() {
let mytextStyle = {
color: "#333",
fontSize: 18,
};
let mylabel = {
show: true,
position: "right",
offset: [30, 40],
formatter: '{b} : {c} ({d}%)',
textStyle: mytextStyle
};
this.chartPie = echarts.init(document.getElementById('chartPie'),'macarons');
this.chartPie.setOption({
title: {
text: 'Pie Chart',
subtext: '纯属虚构',
x: 'center'
},
tooltip: {
trigger: 'item',
formatter: "{a} <br/>{b} : {c} ({d}%)",
},
legend: {
data: ['直接访问', '邮件营销', '联盟广告', '视频广告', '搜索引擎'],
left:"center",
top:"bottom",
orient:"horizontal",
},
series: [
{
name: '访问来源',
type: 'pie',
radius: ['50%', '70%'],
center: ['50%', '50%'],
data: [
{value: 335, name: '直接访问'},
{value: 310, name: '邮件营销'},
{value: 234, name: '联盟广告'},
{value: 135, name: '视频广告'},
{value: 1548, name: '搜索引擎'}
],
animationEasing: 'cubicInOut',
animationDuration: 2600,
label: {
emphasis: mylabel
}
}
]
});
}
}
}
</script>
<style lang='less' scope>
.pie-wrap{
width:100%;
height:400px;
}
</style>
实现效果:
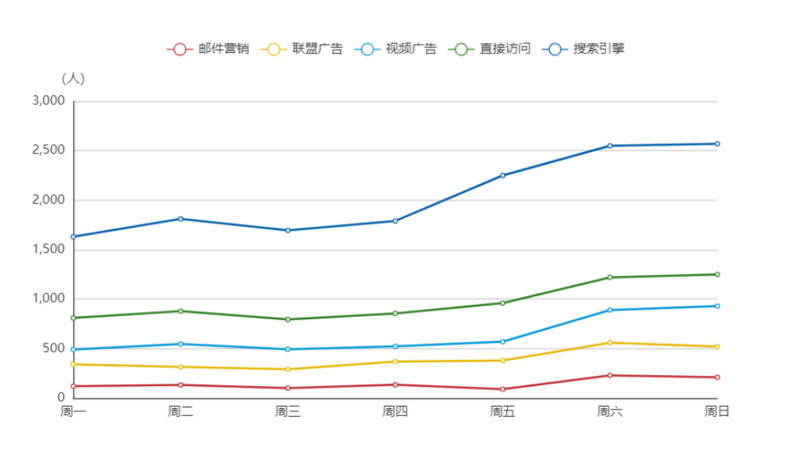
3.使用echarts实现line图
<template> <!-- 为 ECharts 准备一个具备大小(宽高)的 DOM -->
<div id="chartLine" class="line-wrap"></div>
</template>
<script>
import * as echarts from 'echarts';
require('echarts/theme/shine');//引入主题
export default {
data() {
return {
chartLine: null
}
},
mounted() {
this.$nextTick(() => {
this.drawLineChart();
})
},
methods: {
drawLineChart() {
this.chartLine = echarts.init(this.$el,'shine');// 基于准备好的dom,初始化echarts实例
let option = {
tooltip : {
trigger: 'axis'
},
legend: {
data:['邮件营销','联盟广告','视频广告','直接访问','搜索引擎']
},
calculable : true,
xAxis : [
{
type : 'category',
boundaryGap : false,
axisTick: {
show: false
},
data : ['周一','周二','周三','周四','周五','周六','周日']
}
],
yAxis : [
{
type : 'value',
axisTick: {
show: false
},
name: '(人)'
}
],
series : [
{
name:'邮件营销',
type:'line',
stack: '总量',
data:[120, 132, 101, 134, 90, 230, 210]
},
{
name:'联盟广告',
type:'line',
stack: '总量',
data:[220, 182, 191, 234, 290, 330, 310]
},
{
name:'视频广告',
type:'line',
stack: '总量',
data:[150, 232, 201, 154, 190, 330, 410]
},
{
name:'直接访问',
type:'line',
stack: '总量',
data:[320, 332, 301, 334, 390, 330, 320]
},
{
name:'搜索引擎',
type:'line',
stack: '总量',
data:[820, 932, 901, 934, 1290, 1330, 1320]
}
]
};
// 使用刚指定的配置项和数据显示图表
this.chartLine.setOption(option);
}
}
}
</script>
<style lang='less' scope>
.line-wrap{
width:50%;
height:400px;
}
</style>
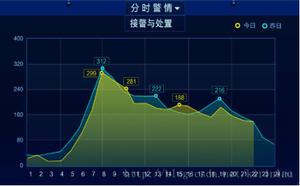
实现效果:
4.echarts基础概念
1)echarts实例
一个网页中可以创建多个 echarts 实例,每个 echarts 实例 中可以创建多个图表和坐标系等等(用 option 来描述)。准备一个 DOM 节点(作为 echarts 的渲染容器),就可以在上面创建一个 echarts 实例。
2)系列(series)
一组数值以及他们映射成的图,一个 系列 包含的要素至少有:一组数值、图表类型(series.type)、以及其他的关于这些数据如何映射成图的参数。
echarts 里系列类型(series.type)就是图表类型。系列类型(series.type)至少有:line(折线图)、bar(柱状图)、pie(饼图)
3)组件(component)
echarts 中至少有这些组件:xAxis(直角坐标系 X 轴)、yAxis(直角坐标系 Y 轴)、grid(直角坐标系底板)、dataZoom(数据区缩放组件)、visualMap(视觉映射组件)、tooltip(提示框组件)、toolbox(工具栏组件)、series(系列)、...
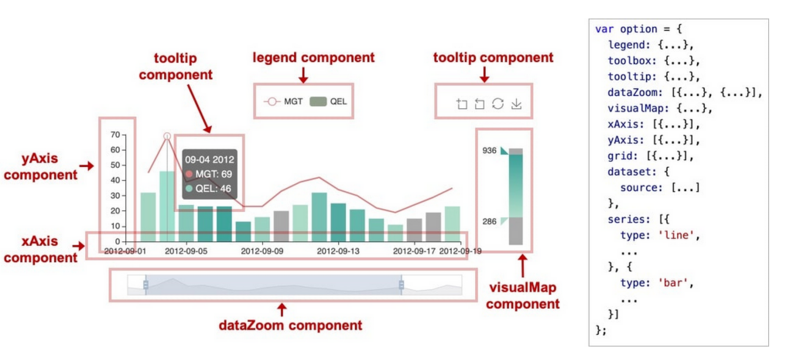
想了解更多去官网https://www.echartsjs.com/zh/...
5.echarts常用配置项和API
1)title标题组件,包含主标题和副标题
title: { text: 'Pie Chart',//主标题文本
subtext: '纯属虚构',//副标题文本
x: 'center',
textStyle:{//主标题样式
color: "#333",
fontSize: 18
},
subtextStyle:{},//副标题样式
itemGap: 10,//主副标题之间的间距
}
2)legend图例组件
legend: { left:"center",//图例组件离容器左侧的距离
top:"bottom",//图例组件离容器上侧的距离
orient:"horizontal",//图例列表的布局朝向
itemGap :20,//图例每项之间的间隔
formatter: function (name) {//用来格式化图例文本,支持字符串模板和回调函数两种形式~~~~
return 'Legend ' + name;
},
icon:'circle',//图例项的 icon
data: [
{
icon: 'triangle',
textStyle: {
color: 'red'
},
name: '直接访问'
},
'邮件营销', '联盟广告', '视频广告', '搜索引擎'],//图例的数据数组
}
3)xAxis直角坐标系 grid 中的 x 轴
xAxis : [ {
type : 'category',//坐标轴类型
boundaryGap : false,
axisTick: {//坐标轴刻度相关设置
show: false
},
data : ['周一','周二','周三','周四','周五','周六','周日']//类目数据
}
]
4)yAxis直角坐标系 grid 中的 y 轴
yAxis : [ {
type : 'value',//坐标轴类型,`'value'` 数值轴,适用于连续数据
axisTick: {
show: false
},
name: '(人)'
}
]
5)tooltip提示框组件
tooltip : { trigger: 'axis',//触发类型,'axis'坐标轴触发,主要在柱状图,折线图等会使用类目轴的图表中使用
formatter: "{a} <br/>{b} : {c} ({d}%)",//模板变量有 `{a}`, `{b}`,`{c}`,`{d}`,`{e}`,分别表示系列名,数据名,数据值等
}
6)series系列列表,每个系列通过 type 决定自己的图表类型
A.series-lineseries : [
{
name:'邮件营销',
type:'line',
stack: '总量',
data:[120, 132, 101, 134, 90, 230, 210],//系列中的数据内容数组
areaStyle:{//区域填充样式
color:'red'
},
lineStyle:{//线条样式
color:'#000'
},
emphasis:{//图形的高亮样式
label:{
color:'red'
}
}
}
]
B.series-pie
series : [
{
name: '访问来源',
type: 'pie',
radius: ['50%', '70%'],//饼图的半径,数组的第一项是内半径,第二项是外半径
center: ['50%', '50%'],//饼图的中心(圆心)坐标,数组的第一项是横坐标,第二项是纵坐标。支持设置成百分比,设置成百分比时第一项是相对于容器宽度,第二项是相对于容器高度
roseType: false,//是否展示成南丁格尔图,通过半径区分数据大小
data: [//系列中的数据内容数组
{value: 335, name: '直接访问'},
{value: 310, name: '邮件营销'},
{value: 234, name: '联盟广告'},
{value: 135, name: '视频广告'},
{value: 1548, name: '搜索引擎'}
],
animationEasing: 'cubicInOut',//初始动画的缓动效果
animationDuration: 2600,//初始动画的时长
label: {
emphasis: mylabel//高亮的扇区和标签样式
}
}
]
想要了解更多,去官网https://www.echartsjs.com/zh/...
以上是 vue+ECharts实现折线图和饼图代码示例 的全部内容, 来源链接: utcz.com/a/13806.html