React性能优化——工具篇

实际上, React 使用 Virtual
DOM 做优化,在内部已经尽可能的减少了真实 DOM 操作,然而还是可以做一些优化。从工具方面,可以使用以下几种工具检测我们的代码性能。
转载https://wulv.site/2017-07-01/react-perf-tools.html
React
Developer Tools for Chrome
这是一个 Chrome 插件,主要用来检测页面使用的 React 版本是否是 Production 版本, development 版本会对代码不规范的的地方打印出 warning ,这些提示其实是很浪费性能的。React
Developer Tools for Chrome可以检测到底使用的是哪个版本,如果插件的背景色是暗黑色的,表示使用 Production 版本:
如果是红色的,表示 development 版本:
Chrome
Performance Tab
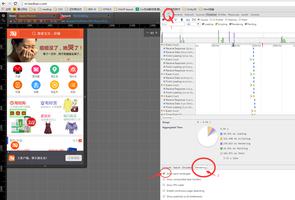
React 15.4.0添加一个查看各组件加载开销详情图表的特性:
- 在
url中添加查询参数?react_perf。比如http://localhost:3000/?react_perf - 打开
Chrome开发工具的Performance窗口,点一下Record。 - 记录你需要分析的操作,最好不要超过20秒。
- 停止记录
- 在
User Timing里查看记录的事件。
react-addons-perf
react-addons-perf这是 React 官方推出的一个性能工具包,可以打印出组件渲染的时间、次数、浪费时间等。
1 2 3 4 | # 安装 yarn add react-addons-perf --save # 引入 import Perf from 'react-addons-perf'; |
主要以下几个 API :
1 2 3 4 5 6 7 8 9 10 | // 开始记录 Perf.start() // 结束记录 Perf.stop() // 获取上次记录 const measurements = Perf.getLastMeasurements() // 打印总时间 Perf.printInclusive(measurements) // 打印浪费时间 Perf.printWasted(measurements) |
这里有一个 Chrome 插件React
Perf,可以在 Chrome Devtools Panel 添加一个 tab 快速的查看打印日志。
注意:此插件需要在全局变量暴露
Perf
1
2
import Perf from 'react-addons-perf'
window.Perf = Perf
why-did-you-update
why-did-you-update会比较组件的 state 和 props 的变化,如果两次渲染值是没有改变的,会提示去避免re-render。
1 2 3 4 5 6 7 8 9 | #安装 npm install --save-dev why-did-you-update # 使用 import React from 'react' if (process.env.NODE_ENV !== 'production') { const {whyDidYouUpdate} = require('why-did-you-update') whyDidYouUpdate(React) } |
这个包在React 15.6.0好像有点问题,需要添加一下代码才能工作,这个 bug 即将修复。
1 2 3 4 5 6 | let createClass = React.createClass; Object.defineProperty(React, 'createClass', { set: (nextCreateClass) => { createClass = nextCreateClass; } }); |
react-perf-tool
eact-perf-tool以柱形图的方式比较直观的展现组件浪费的时间。(感觉并不好用)
1 | yarn add --save-dev react-perf-tool |
1 2 3 4 5 6 7 8 9 10 11 12 | import ReactPerfTool from 'react-perf-tool'; import Perf from 'react-addons-perf'; // Import styles if they don't get loaded already import 'react-perf-tool/lib/styles.css'; export default function YourApp(props) { return (<div className="your-app"> {/*...yourApp */} <ReactPerfTool perf={Perf} /> </div>); } |
自己写一个组件
1 2 3 4 5 6 7 8 9 10 11 12 13 14 15 16 17 18 19 20 21 22 23 24 25 26 27 28 29 30 31 32 33 34 35 36 37 38 39 40 41 42 43 44 45 | // PerfProfiler/index.js import React from 'react'; import Perf from 'react-addons-perf'; import './style.css'; class PerfProfiler extends React.Component { constructor(props) { super(props); this.state = { started: false }; } toggle = () => { const { started } = this.state; started ? Perf.stop() : Perf.start(); this.setState({ started: !started }); } printWasted = () => { const lastMeasurements = Perf.getLastMeasurements(); Perf.printWasted(lastMeasurements); } printOperations = () => { const lastMeasurements = Perf.getLastMeasurements(); Perf.printOperations(lastMeasurements); } render() { const { started } = this.state; return <div className="perf-profiler"> <h1>Performance Profiler</h1> <button onClick={this.toggle}>{started ? 'Stop' : 'Start'}</button> <button onClick={this.printWasted}>Print Wasted</button> <button onClick={this.printOperations}>Print Operations</button> </div>; } } export default PerfProfiler; |
1 2 3 4 5 6 7 8 9 10 11 12 13 14 15 16 17 18 19 20 21 22 | /* PerfProfiler/style.css */ .perf-profiler { display: flex; flex-direction: column; position: absolute; right: 50px; top: 20px; padding: 10px; background: #bada55; border: 2px solid black; text-align: center; } .perf-profiler > h1 { font-size: 1.5em; } .perf-profiler > button { display: block; margin-top: 10px; padding: 5px; } |
引用组件:
1 2 3 4 5 6 7 8 | import PerfProfiler from './PerfProfiler'; export default function YourApp(props) { return (<div className="your-app"> {/*...yourApp */} <PerfProfiler /> </div>); } |
以上是 React性能优化——工具篇 的全部内容, 来源链接: utcz.com/z/384448.html