Vue+Openlayers实现地图上绘制线

场景
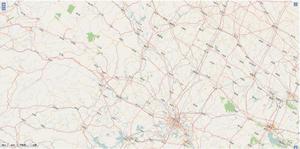
Vue+Openlayers实现显示图片并分优先级多图层加载:
https://blog.csdn.net/BADAO_LIUMANG_QIZHI/article/details/121235987
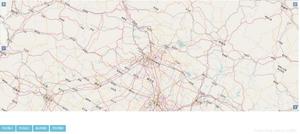
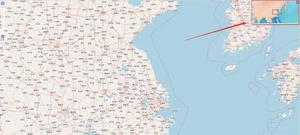
上面是添加多个点的图层,如果添加线的图层,形如下面的效果
注:
博客:
https://blog.csdn.net/badao_liumang_qizhi
关注公众号
霸道的程序猿
获取编程相关电子书、教程推送与免费下载。
实现
1、导入新的模块
//导入基本模块import "ol/ol.css";
import Map from "ol/Map";
import View from "ol/View";
import { Point,LineString } from "ol/geom";
import Feature from "ol/Feature";
import { Icon,Style,Stroke} from "ol/style";
//导入相关模块
import { Tile as TileLayer , Vector as VectorLayer } from \'ol/layer\'
import { TileWMS ,Vector as VectorSource } from \'ol/source\'
2、声明一个线的图层和数据源
data() { return {
map: null, // map地图
layer:null, //地图图层
lightLayer:null, //灯图层
houseLayer:null, //房子图层
lineLayer:null, //线图层
lineSource:null, //线数据源
3、添加要绘制的线的坐标数组
注意这里必须是数组嵌套数组的格式
//线的数据lineData:[
[986434.4063822062, 215782.0959711917],
[989701.5290279881,217149.84072807242],
[990613.3107184113,215946.4192185118],
],
这里是三个坐标点,会将这三个点依次连接起来
4、线的图层进行赋值
//线的图层this.lineSource = new VectorSource({ wrapX: false });
this.lineLayer = new VectorLayer({
source: this.lineSource,
});
5、map中加入线的图层
this.map = new Map({ //地图容器ID
target: "map",
//引入地图
layers: [this.layer,this.lightLayer,this.houseLayer,this.lineLayer],
view: new View({
//地图中心点
center: [987777.93778, 213834.81024],
zoom: 12,
minZoom:6, // 地图缩放最小级别
maxZoom:19,
}),
});
6、页面加载完调用初始化地图的方法,方法中调用画线的方法
//画线drawLine(){
let pointData = this.lineData; // 所有点位信息
//下边来添加一线feature
var feature = new Feature({
type: "lineStyle",
geometry: new LineString(
pointData // 线的坐标
),
});
let color = \'green\';
let lineStyle = new Style({
stroke: new Stroke({
color: color,
width: 4,
}),
});
// 添加线的样式
feature.setStyle(lineStyle);
// 添加线的fature
this.lineSource.addFeature(feature);
},
7、完整示例代码
<template><div id="map" class="map"></div>
</template>
<script>
//导入基本模块
import "ol/ol.css";
import Map from "ol/Map";
import View from "ol/View";
import { Point,LineString } from "ol/geom";
import Feature from "ol/Feature";
import { Icon,Style,Stroke} from "ol/style";
//导入相关模块
import { Tile as TileLayer , Vector as VectorLayer } from \'ol/layer\'
import { TileWMS ,Vector as VectorSource } from \'ol/source\'
export default {
name: "olMapImageWMSMulLayers",
data() {
return {
map: null, // map地图
layer:null, //地图图层
lightLayer:null, //灯图层
houseLayer:null, //房子图层
lineLayer:null, //线图层
lineSource:null, //线数据源
//红绿灯数据
lightData:[
{x:"987798.93778", y:"213885.81024"},
{x:"987710.93778", y:"213810.81024"},
],
//房子数据
houseData:[
{x:"986610.93778", y:"213885.81024"},
{x:"986510.93778", y:"213810.81024"},
],
//线的数据
lineData:[
[986434.4063822062, 215782.0959711917],
[989701.5290279881,217149.84072807242],
[990613.3107184113,215946.4192185118],
],
};
},
mounted() {
this.initMap();
setInterval(() => {
this.initLightData();
}, 1000)
},
methods: {
//初始化红绿灯数据
initLightData(){
this.lightLayer.getSource().clear();
this.lightData.forEach((item, index) => {
var feature = new Feature({
geometry: new Point([Number(item.x), Number(item.y)]),
});
let url = "images/light.png";
const zoom = this.map.getView().getZoom();
let style = new Style({
image: new Icon({
scale: 0.15 * (zoom -13) ,
src: url,
anchor: [0.48, 0.52],
}),
});
feature.setStyle(style);
this.lightLayer.getSource().addFeature(feature);
});
},
//初始化房子数据
initHouseData(){
this.houseLayer.getSource().clear();
this.houseData.forEach((item, index) => {
var feature = new Feature({
geometry: new Point([Number(item.x), Number(item.y)]),
});
let url = "images/house.png";
let style = new Style({
image: new Icon({
scale: 0.3,
src: url,
anchor: [0.48, 0.52],
}),
});
feature.setStyle(style);
this.houseLayer.getSource().addFeature(feature);
});
},
//画线
drawLine(){
let pointData = this.lineData; // 所有点位信息
//下边来添加一线feature
var feature = new Feature({
type: "lineStyle",
geometry: new LineString(
pointData // 线的坐标
),
});
let color = \'green\';
let lineStyle = new Style({
stroke: new Stroke({
color: color,
width: 4,
}),
});
// 添加线的样式
feature.setStyle(lineStyle);
// 添加线的fature
this.lineSource.addFeature(feature);
},
initMap() {
//地图图层
this.layer = new TileLayer({
source: new TileWMS({
//不能设置为0,否则地图不展示。
ratio: 1,
url: "http://localhost:8000/geoserver/nyc/wms",
params: {
LAYERS: "nyc:nyc_roads",
STYLES: "",
VERSION: "1.1.1",
tiled: true
},
serverType: "geoserver",
}),
});
// 红绿灯的图层
this.lightLayer = new VectorLayer({
source: new VectorSource(),
});
//房子的图层
this.houseLayer = new VectorLayer({
source: new VectorSource(),
});
//线的图层
this.lineSource = new VectorSource({ wrapX: false });
this.lineLayer = new VectorLayer({
source: this.lineSource,
});
this.map = new Map({
//地图容器ID
target: "map",
//引入地图
layers: [this.layer,this.lightLayer,this.houseLayer,this.lineLayer],
view: new View({
//地图中心点
center: [987777.93778, 213834.81024],
zoom: 12,
minZoom:6, // 地图缩放最小级别
maxZoom:19,
}),
});
this.initLightData();
this.initHouseData();
this.drawLine();
//获取点的监听方法设置
this.onPoint()
},
// 获取点
onPoint() {
// 监听singleclick事件
this.map.on(\'singleclick\', function(e) {
console.log(e.coordinate)
})
}
},
};
</script>
<style scoped>
.map {
width: 100%;
height: 800px;
}
</style>
以上是 Vue+Openlayers实现地图上绘制线 的全部内容, 来源链接: utcz.com/z/375280.html