Python爬取当网书籍数据并数据可视化展示
一、开发环境
- Python 3.8
- Pycharm 2021.2 专业版
二、模块使用
csv 模块 把爬取下来的数据保存表格里面的 内置模块requests >>> pip install requests 数据请求模块parsel >>> pip install parsel 数据解析模块 css选择器去提取数据
三、爬虫代码实现步骤
- 导入所需模块
- 发送请求, 用
python代码模拟浏览器发送请求 - 解析数据, 提取我们想要数据内容
- 多页爬取
- 保存数据, 保存
csv表格里面
1. 导入所需模块
import requests # 数据请求模块 第三方模块 需要 pip install requestsimport parsel # 数据解析模块 第三方模块 需要 pip install parsel
import csv # 保存csv表格数据模块 内置模块
import time # 时间模块
2. 发送请求, 用python代码模拟浏览器发送请求
headers 请求头 作用就是python代码伪装成浏览器 对于服务器发送请求
User-Agent 用户代理 浏览器的基本身份标识
标题中无效的返回字符或前导空格:User-Agent 不要留有空格
通过requests模块里面get请求方法,对于url地址发送请求,并且携带上面header请求头参数,最后用response变量接收返回数据
url = f'http://bang.dangdang.com/books/bestsellers/01.00.00.00.00.00-24hours-0-0-1-{page}'# headers 请求头 字典数据类型
headers = {
'User-Agent': 'Mozilla/5.0 (Windows NT 10.0; Win64; x64) AppleWebKit/537.36 (KHTML, like Gecko) Chrome/96.0.4664.45 Safari/537.36'
}
response = requests.get(url=url, headers=headers)
3. 解析数据, 提取我们想要数据内容
selector = parsel.Selector(response.text) # 对于获取到的html字符串数据进行转换 selector 对象# css选择器 就是根据标签属性提取相应的数据
lis = selector.css('ul.bang_list li')
for li in lis:
# .name 定位 class类名name标签 a 标签 attr() 属性选择器 取a标签里面title属性 get() 获取数据
title = li.css('.name a::attr(title)').get() # 书名
# 获取标签里面文本数据 直接text
comment = li.css('.star a::text').get().replace('条评论', '') # 评论
recommend = li.css('.star .tuijian::text').get().replace('推荐', '') # 推荐
author = li.css('.publisher_info a:nth-child(1)::attr(title)').get() # 作者
publish = li.css('div:nth-child(6) a::text').get() # 出版社
price_n = li.css('.price .price_n::text').get() # 售价
price_r = li.css('.price .price_r::text').get() # 原价
price_s = li.css('.price .price_s::text').get() # 折扣
price_e = li.css('.price .price_e .price_n::text').get() # 电子书价格
href = li.css('.name a::attr(href)').get() # 详情页
dit = {
'书名': title,
'评论数': comment,
'推荐量': recommend,
'作者': author,
'出版社': publish,
'售价': price_n,
'原价': price_r,
'折扣': price_s,
'电子书价格': price_e,
'详情页': href,
}
csv_writer.writerow(dit) # 数据保存到csv
print(title, comment, recommend, author, publish, price_n, price_r, price_s, price_e, href, sep=' | ')
4. 多页爬取
for page in range(1, 26):# 字符串格式化方法
print(f'正在爬取第{page}页的数据内容')
time.sleep(1.5)
url = f'http://bang.dangdang.com/books/bestsellers/01.00.00.00.00.00-24hours-0-0-1-{page}'
5. 保存数据, 保存csv表格里面
# 创建打开一个文件 进行保存f = open('当当图书.csv', mode='a', encoding='utf-8', newline='')
csv_writer = csv.DictWriter(f, fieldnames=[
'书名',
'评论数',
'推荐量',
'作者',
'出版社',
'售价',
'原价',
'折扣',
'电子书价格',
'详情页',
])
csv_writer.writeheader() # 写入表头
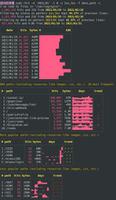
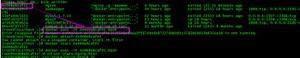
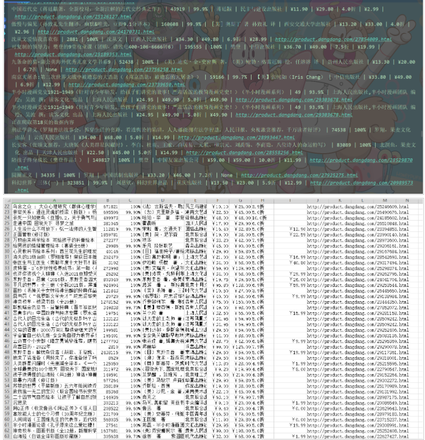
运行代码,效果如下图:
四、数据可视化
1.导入所需模块
import pandas as pdfrom pyecharts.charts import *
from pyecharts.globals import ThemeType#设定主题
from pyecharts.commons.utils import JsCode
import pyecharts.options as opts
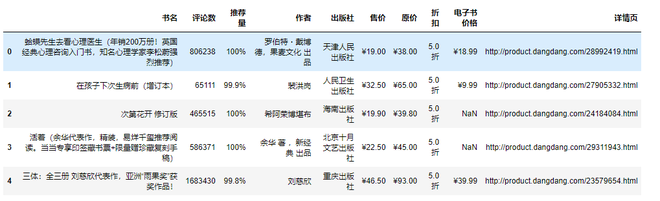
2.导入数据
df = pd.read_csv('书籍信息.csv', encoding='utf-8', engine='python')df.head()
3.可视化
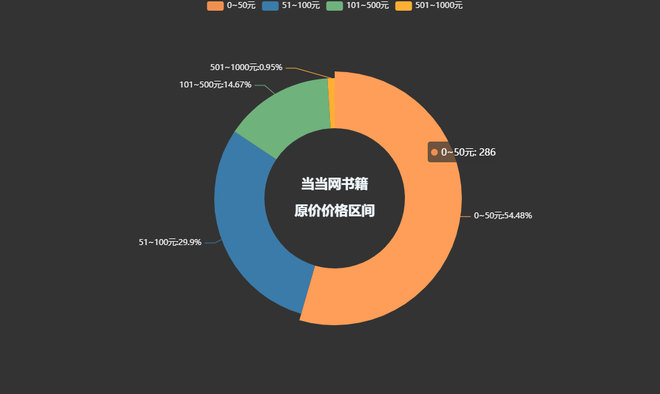
书籍总体价格区间:
pie1 = (Pie(init_opts=opts.InitOpts(theme='dark',width='1000px',height='600px'))
.add('', datas_pair_1, radius=['35%', '60%'])
.set_series_opts(label_opts=opts.LabelOpts(formatter="{b}:{d}%"))
.set_global_opts(
title_opts=opts.TitleOpts(
title="当当网书籍\n\n原价价格区间",
pos_left='center',
pos_top='center',
title_textstyle_opts=opts.TextStyleOpts(
color='#F0F8FF',
font_size=20,
font_weight='bold'
),
)
)
.set_colors(['#EF9050', '#3B7BA9', '#6FB27C', '#FFAF34', '#D8BFD8', '#00BFFF', '#7FFFAA'])
)
pie1.render_notebook()
pie1 = (Pie(init_opts=opts.InitOpts(theme='dark',width='1000px',height='600px'))
.add('', datas_pair_2, radius=['35%', '60%'])
.set_series_opts(label_opts=opts.LabelOpts(formatter="{b}:{d}%"))
.set_global_opts(
title_opts=opts.TitleOpts(
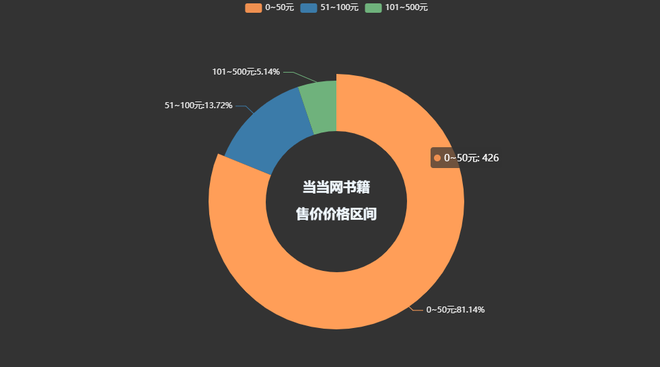
title="当当网书籍\n\n售价价格区间",
pos_left='center',
pos_top='center',
title_textstyle_opts=opts.TextStyleOpts(
color='#F0F8FF',
font_size=20,
font_weight='bold'
),
)
)
.set_colors(['#EF9050', '#3B7BA9', '#6FB27C', '#FFAF34', '#D8BFD8', '#00BFFF', '#7FFFAA'])
)
pie1.render_notebook()
各个出版社书籍数量柱状图:
bar=(Bar(init_opts=opts.InitOpts(height='500px',width='1000px',theme='dark'))
.add_xaxis(counts.index.tolist())
.add_yaxis(
'出版社书籍数量',
counts.values.tolist(),
label_opts=opts.LabelOpts(is_show=True,position='top'),
itemstyle_opts=opts.ItemStyleOpts(
color=JsCode("""new echarts.graphic.LinearGradient(
0, 0, 0, 1,[{offset: 0,color: 'rgb(255,99,71)'}, {offset: 1,color: 'rgb(32,178,170)'}])
"""
)
)
)
.set_global_opts(
title_opts=opts.TitleOpts(
title='各个出版社书籍数量柱状图'),
xaxis_opts=opts.AxisOpts(name='书籍名称',
type_='category',
axislabel_opts=opts.LabelOpts(rotate=90),
),
yaxis_opts=opts.AxisOpts(
name='数量',
min_=0,
max_=29.0,
splitline_opts=opts.SplitLineOpts(is_show=True,linestyle_opts=opts.LineStyleOpts(type_='dash'))
),
tooltip_opts=opts.TooltipOpts(trigger='axis',axis_pointer_type='cross')
)
.set_series_opts(
markline_opts=opts.MarkLineOpts(
data=[
opts.MarkLineItem(type_='average',name='均值'),
opts.MarkLineItem(type_='max',name='最大值'),
opts.MarkLineItem(type_='min',name='最小值'),
]
)
)
)
bar.render_notebook()
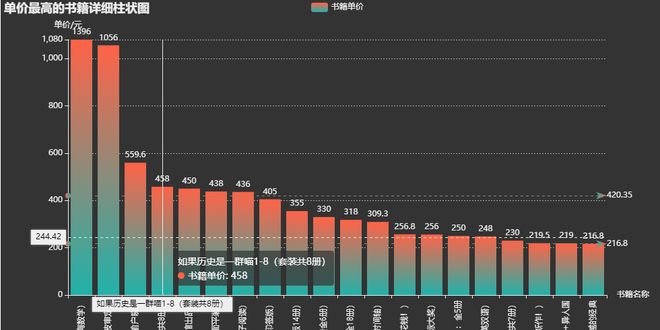
书籍评论数最高Top20:
bar=(Bar(init_opts=opts.InitOpts(height='500px',width='1000px',theme='dark'))
.add_xaxis(price_top.index.tolist())
.add_yaxis(
'书籍单价',
price_top.values.tolist(),
label_opts=opts.LabelOpts(is_show=True,position='top'),
itemstyle_opts=opts.ItemStyleOpts(
color=JsCode("""new echarts.graphic.LinearGradient(
0, 0, 0, 1,[{offset: 0,color: 'rgb(255,99,71)'}, {offset: 1,color: 'rgb(32,178,170)'}])
"""
)
)
)
.set_global_opts(
title_opts=opts.TitleOpts(
title='单价最高的书籍详细柱状图'),
xaxis_opts=opts.AxisOpts(name='书籍名称',
type_='category',
axislabel_opts=opts.LabelOpts(rotate=90),
),
yaxis_opts=opts.AxisOpts(
name='单价/元',
min_=0,
max_=1080.0,
splitline_opts=opts.SplitLineOpts(is_show=True,linestyle_opts=opts.LineStyleOpts(type_='dash'))
),
tooltip_opts=opts.TooltipOpts(trigger='axis',axis_pointer_type='cross')
)
.set_series_opts(
markline_opts=opts.MarkLineOpts(
data=[
opts.MarkLineItem(type_='average',name='均值'),
opts.MarkLineItem(type_='max',name='最大值'),
opts.MarkLineItem(type_='min',name='最小值'),
]
)
)
)
bar.render_notebook()
到此这篇关于Python爬取当网书籍数据并数据可视化展示的文章就介绍到这了,更多相关Python爬取当网书籍数据内容请搜索以前的文章或继续浏览下面的相关文章希望大家以后多多支持!
以上是 Python爬取当网书籍数据并数据可视化展示 的全部内容, 来源链接: utcz.com/z/257009.html