Python 有什么库可以在命令行绘图?
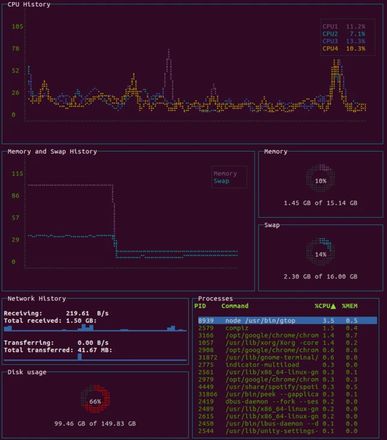
类似上面这样的图
不是 GUI
回答:
这种在终端下绘图的技术一般称为TUI,而python的TUI类库也不少,比如这个: https://github.com/bczsalba/p...
回答:
可以用 curses 或者 blessed
前者是标准库,后者是基于 curses 封装了一下
比如用 curses 实现一个简易版本的 htop
import timeimport psutil
from blessed import Terminal
# 初始化终端
term = Terminal()
# 绘制坐标轴
def draw_axes():
with term.location(x=2, y=2):
print("+" + "-" * 50 + "> Time")
for y in range(20):
with term.location(x=1, y=21 - y):
print(f"{y * 5:3} |")
with term.location(x=1, y=22):
print("CPU")
# 绘制折线图
def draw_line_chart(data_points):
with term.location(x=3, y=21):
for x, y in enumerate(data_points):
with term.location(x=x * 2 + 3, y=20 - y):
print(term.bold_red_on_white("█"))
# 主程序
def main():
data_points = [0] * 60
with term.fullscreen():
with term.cbreak():
term.inkey(timeout=0.1)
while True:
cpu_percent = psutil.cpu_percent(interval=1) # 获取 CPU 利用率
data_points.pop(0) # 移除第一个数据点
data_points.append(int(cpu_percent / 5)) # 添加新数据点到末尾
with term.location():
term.clear()
draw_axes()
draw_line_chart(data_points)
time.sleep(0.1)
if __name__ == "__main__":
main()
注意,上面的代码,只能跑在 linux 上
Q:使用 python 的 curses ,实现画两个折线,一个是随着时间变化的内存利用率,一个是随着时间变化的cpu利用率。横坐标是时间,纵坐标就是利用率
A:
import cursesimport psutil
import time
def draw_line(window, data, color_pair):
height, width = window.getmaxyx()
max_data_points = width - 2 # Leave space for borders
scale_factor = max_data_points / 100.0
for i in range(min(len(data), max_data_points)):
y = int(height - 2 - data[i] * scale_factor)
x = i + 1
# Ensure y is within the window bounds
if 0 < y < height - 1 and 0 < x < width - 1:
window.addch(y, x, '*', curses.color_pair(color_pair))
def main(stdscr):
curses.curs_set(0) # Hide the cursor
curses.start_color()
curses.init_pair(1, curses.COLOR_BLUE, curses.COLOR_BLACK) # Memory line color
curses.init_pair(2, curses.COLOR_RED, curses.COLOR_BLACK) # CPU line color
stdscr.clear()
memory_data = []
cpu_data = []
while True:
# Get memory and CPU usage
memory_percent = psutil.virtual_memory().percent
cpu_percent = psutil.cpu_percent(interval=1)
# Add data points to the lists
memory_data.append(memory_percent)
cpu_data.append(cpu_percent)
# Draw memory and CPU lines
draw_line(stdscr, memory_data, 1)
draw_line(stdscr, cpu_data, 2)
stdscr.refresh()
stdscr.clear()
if __name__ == "__main__":
curses.wrapper(main)
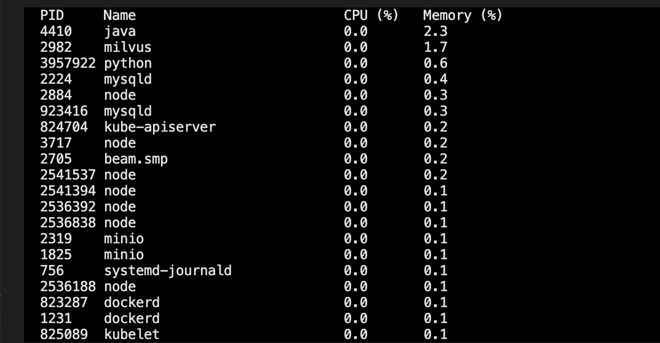
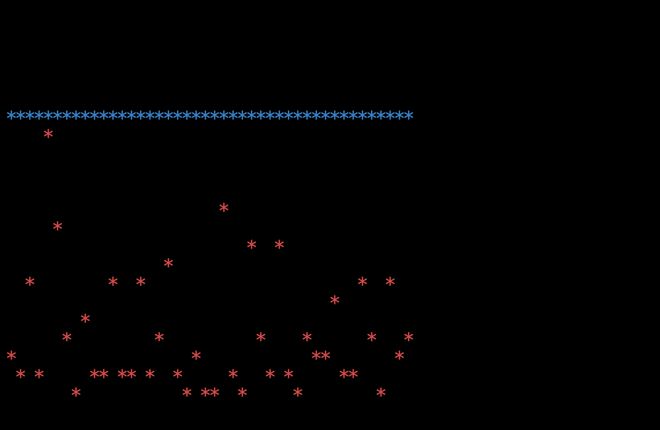
效果
以上是 Python 有什么库可以在命令行绘图? 的全部内容, 来源链接: utcz.com/p/938491.html


