侧边栏收起后主界面元素如何自动改变宽度?
两个问题,请大神帮忙解答下:
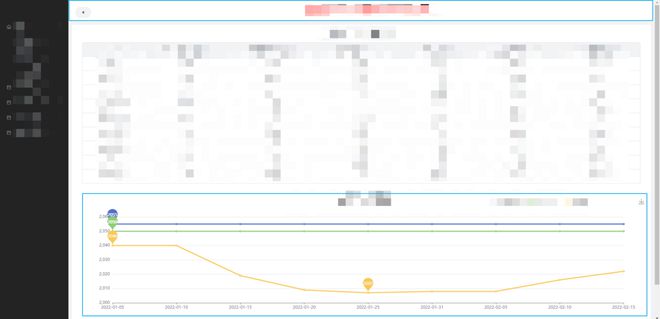
1.这个图上侧蓝框<header>部分如何在滚动条下滑时固定?
2.在左侧边栏未收起时,echarts组件可以填满主界面,收起时,蓝框部分应该使用哪种属性能自动填充或者echarts组件居中?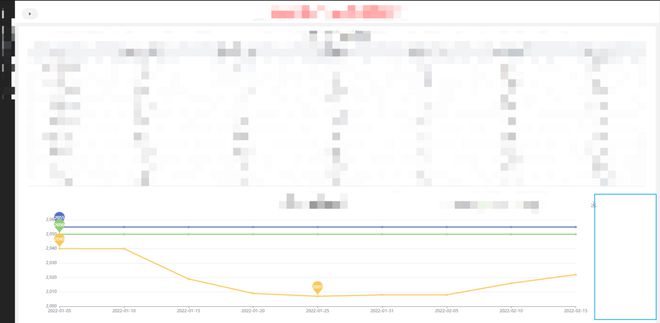
echarts样式设置:
<div id="clqx" style="width: 100%; height: 400px"></div>App.vue
<template> <a-layout class="layout-demo">
<a-layout-sider hide-trigger collapsible :collapsed="collapsed" theme="dark">
<div class="logo" />
<a-menu
:defaultOpenKeys="['1']"
:defaultSelectedKeys="['0_3']"
:style="{ width: '100%' }"
@menuItemClick="onClickMenuItem"
>
<a-sub-menu key="1">
<template #title>
<span><IconHome />1</span>
</template>
<a-menu-item key="1_1">1</a-menu-item>
<a-menu-item key="1_2">1</a-menu-item>
<a-menu-item key="1_3">1</a-menu-item>
</a-sub-menu>
<a-sub-menu key="2">
<template #title>
<span><IconCalendar />1</span>
</template>
<a-menu-item key="2_1">1</a-menu-item>
<a-menu-item key="2_2">1</a-menu-item>
</a-sub-menu>
<a-sub-menu key="3">
<template #title>
<span><IconCalendar />1</span>
</template>
<a-menu-item key="3_1">1</a-menu-item>
<a-menu-item key="3_2">1</a-menu-item>
</a-sub-menu>
<a-sub-menu key="4">
<template #title>
<span><IconCalendar />1</span>
</template>
<a-menu-item key="4_1">1</a-menu-item>
<a-menu-item key="4_2">1</a-menu-item>
</a-sub-menu>
<a-sub-menu key="5">
<template #title>
<span><IconCalendar />1</span>
</template>
<a-menu-item key="5_1">1</a-menu-item>
<a-menu-item key="5_2">1</a-menu-item>
</a-sub-menu>
</a-menu>
</a-layout-sider>
<a-layout>
<a-layout-header style="padding-left: 20px">
<a-button shape="round" @click="onCollapse">
<IconCaretRight v-if="collapsed" />
<IconCaretLeft v-else />
</a-button>
<span
style="
font-size: 200%;
font-weight: bold;
color: rgba(255, 0, 0, 0.63);
margin-left: 37%;
"
>运行情况分析</span
>
</a-layout-header>
<a-layout style="padding: 10px 10px 10px 10px">
<!-- <a-breadcrumb :style="{ margin: '16px 0' }">
<a-breadcrumb-item>Home</a-breadcrumb-item>
<a-breadcrumb-item>List</a-breadcrumb-item>
<a-breadcrumb-item>App</a-breadcrumb-item>
</a-breadcrumb> -->
<a-layout-content><HelloWorld /></a-layout-content>
<a-layout-footer>Footer22222</a-layout-footer>
</a-layout>
</a-layout>
</a-layout>
</template>
<script lang="ts">
// This starter template is using Vue 3 <script setup> SFCs
// Check out https://v3.vuejs.org/api/sfc-script-setup.html#sfc-script-setup
import HelloWorld from "./components/HelloWorld.vue";
import { defineComponent, ref } from "vue";
import { Message } from "@arco-design/web-vue";
import {
IconCaretRight,
IconCaretLeft,
IconHome,
IconCalendar,
} from "@arco-design/web-vue/es/icon";
export default defineComponent({
components: {
IconCaretRight,
IconCaretLeft,
IconHome,
IconCalendar,
HelloWorld,
},
setup() {
const collapsed = ref(false);
const onCollapse = () => {
collapsed.value = !collapsed.value;
};
return {
collapsed,
onCollapse,
onClickMenuItem(key: unknown) {
Message.info({ content: `You select ${key}`, showIcon: true });
},
};
},
});
</script>
<style scoped>
/* #app {
font-family: Avenir, Helvetica, Arial, sans-serif;
-webkit-font-smoothing: antialiased;
-moz-osx-font-smoothing: grayscale;
text-align: center;
color: #2c3e50;
margin-top: 0px;
} */
* {
margin: 0px;
padding: 0px;
box-sizing: border-box;
font-family: "Microsoft YaHei";
}
.layout-demo {
background: var(--color-fill-2);
/* border: 1px solid var(--color-border); */
height: 100vh;
}
.layout-demo :deep(.arco-layout-sider) .logo {
height: 32px;
margin: 12px 8px;
/* background: rgba(255, 255, 255, 0.2); */
}
.layout-demo :deep(.arco-layout-sider-light) .logo {
background: #fff;
}
.layout-demo :deep(.arco-layout-header) {
height: 64px;
line-height: 64px;
background: var(--color-bg-3);
}
.layout-demo :deep(.arco-layout-footer) {
height: 48px;
color: var(--color-text-2);
font-weight: 400;
font-size: 14px;
line-height: 48px;
}
.layout-demo :deep(.arco-layout-content) {
color: var(--color-text-2);
font-weight: 400;
font-size: 14px;
background: var(--color-bg-3);
padding: 10px 30px 10px 30px;
}
.layout-demo :deep(.arco-layout-footer),
.layout-demo :deep(.arco-layout-content) {
display: flex;
flex-direction: column;
justify-content: center;
color: black;
font-size: 16px;
font-stretch: condensed;
text-align: center;
}
</style>
HelloWorld.vue
<template> <a-row class="grid-demo">
<a-col :span="24">
<div style="font-size: 20px; font-weight: bold">量 情 况</div>
<br />
<a-table :columns="columns" :data="tableData" :pagination="false" />
<br />
<br />
<div id="clqx" style="width: 100%; height: 400px"></div>
</a-col>
</a-row>
</template>
<script lang="ts">
import * as echarts from "echarts";
import axios from "axios";
import * as _ from "lodash";
export default {
data() {
return {
/*
表格代码
*/
columns: [
{
title: "日期",
dataIndex: "rq",
sortable: {
sortDirections: ["descend", "ascend"],
},
align: "center",
cellStyle: { "justify-content": "center" },
},
{
title: "1(吨)",
dataIndex: "ndrpc",
sortable: {
sortDirections: ["ascend", "descend"],
},
align: "center",
cellStyle: { "justify-content": "center" },
},
{
title: "1(吨)",
dataIndex: "ydrpc",
sortable: {
sortDirections: ["ascend", "descend"],
},
align: "center",
cellStyle: { "justify-content": "center" },
},
{
title: "1(吨)",
dataIndex: "wccl",
sortable: {
sortDirections: ["ascend", "descend"],
},
align: "center",
cellStyle: { "justify-content": "center" },
},
{
title: "1(口)",
dataIndex: "kjs",
sortable: {
sortDirections: ["ascend", "descend"],
},
align: "center",
cellStyle: { "justify-content": "center" },
},
{
title: "1(吨)",
dataIndex: "jkyl",
sortable: {
sortDirections: ["ascend", "descend"],
},
align: "center",
cellStyle: { "justify-content": "center" },
},
{
title: "1(吨)",
dataIndex: "jkcl",
sortable: {
sortDirections: ["ascend", "descend"],
},
align: "center",
cellStyle: { "justify-content": "center" },
},
],
tableData: [],
};
},
mounted() {
this.getData();
// this.drawLine();
// console.log(this.tableData);
},
methods: {
getData: async function () {
let result: unknown[] = [];
let temp: unknown[] = [];
let legendData: string[] = ["配产", "配产", "完成"];
let xAxisData: string[] = [];
let series: any[] = [];
let ndrpcData: number[] = [];
let ydrpcData: number[] = [];
let wcclData: number[] = [];
let url = "api/cl";
await axios.get(url).then((response) => {
temp = response.data; //获取data数据
});
for (let i: number = 0; i < temp.length; i++) {
let temp_obj = {
rq: temp[i]["rq"],
ndrpc: temp[i]["qc_ndrpc"],
ydrpc: temp[i]["qc_ydrpc"],
wccl: temp[i]["qc_wccl"],
jkyl: temp[i]["qc_jkyl"],
jkcl: temp[i]["qc_jkcl"].toFixed(1),
kjs: temp[i]["qc_kjs"],
};
ndrpcData.push(temp[i]["qc_ndrpc"]);
ydrpcData.push(temp[i]["qc_ydrpc"]);
wcclData.push(temp[i]["qc_wccl"]);
xAxisData.push(temp[i]["rq"]);
result.push(temp_obj);
}
series = [ndrpcData, ydrpcData, wcclData];
this.tableData = result;
let title: string = "完成情况";
this.drawLine(title, legendData, xAxisData, series);
},
drawLine: async function (
title: string,
legendData: string[],
xAxisData: string[],
series: any[]
) {
let seriesData: any[] = [];
for (let i: number = 0; i < legendData.length; i++) {
let temp_obj = {
name: legendData[i],
type: "line",
// stack: "Total", 如果不注释 y轴数值叠加
data: series[i],
lineStyle: {
width: 3,
},
markPoint: {
label: {
color: "#fff",
},
data: [
{ type: "max", name: "Max" },
{ type: "min", name: "Min" },
],
},
};
seriesData.push(temp_obj);
}
let myChart = echarts.init(document.getElementById("clqx") as HTMLCanvasElement);
let option: echarts.EChartsOption;
option = {
title: {
text: title,
left: "center",
},
tooltip: {
trigger: "axis",
},
legend: {
// data: ["Email", "Union Ads", "Video Ads", "Direct", "Search Engine"],
data: legendData,
top: "2%",
right: "10%",
},
grid: {
left: "3%",
right: "4%",
// bottom: "3%",
containLabel: true,
},
toolbox: {
feature: {
saveAsImage: {
type: "png",
title: "保存为图片",
},
},
},
xAxis: {
type: "category",
boundaryGap: false,
// data: ["Mon", "Tue", "Wed", "Thu", "Fri", "Sat", "Sun"],
data: xAxisData,
},
yAxis: {
type: "value",
scale: true,
},
series: seriesData,
};
option && myChart.setOption(option);
window.addEventListener("resize", () => {
myChart.resize();
});
},
},
};
</script>
<style></style>
回答:
header 定位问题
position: fixed- 或者一些图钉组件
- 或者修改布局为局部滚动
echarts
- 执行自己的 resize 方法
- 居中的话可以
margin:auto
以上是 侧边栏收起后主界面元素如何自动改变宽度? 的全部内容, 来源链接: utcz.com/p/937277.html