Vue中props传值给子组件,子组件接收到props值赋值到data中的,再把data传给echarts,但并没有显示出图形
问题是这样的,父组件通过异步方式接收到数据,通过props传递到子组件,子组件再把接收到的数组放到Data中,和data中的其它数据合成一个大对象,再用props方式传给下一个组件,但是下一个组件并没有及时接收到父组件传过来的数组。请问要怎么才能让第三级子组件能及时接收到数据呢?
组件a异步获取数据--props--》B组件,b组件的数据和data中的数据混合为echarts的初始对象,--》再传到下级组件,现在是这一级接收不到a组件的数据,echarts图形显示不出来,如果在B组件中写一个固定的数组,图表就能显示出来。请问大侠这个要怎么传!
这是c组件
import * as echarts from "echarts" export default {
name: "Chart",
data(){
return{
chart:null
}
},
props:{
option:{
type:Object,
required:true
}
},
mounted(){
this.initChart();
// this.chart.setOption(this.option);
},
methods:{
initChart(){
this.chart=echarts.init(this.$refs.chartRef);
}
},
watch:{
deep: true,
option:{
handler(val,oval){
console.log(val);
this.chart.setOption(val)
}
}
}
}
下面是B组件
import Chart from './Chart.vue'; export default {
name: "CurveChart",
data(){
return{
rate:"",
option:{}
}
},
props:{
rateList:{
type:Array,
required:true
}
},
created(){
},
mounted(){
this.option = {
title:{
text:'统计图',
textStyle:{
color:'#ff9900'
},
left: "5%"
},
xAxis: {
type: 'category',
data:[1,2,3,4,5,6,7],
boundaryGap:false
},
yAxis: {
type: 'value',
name:'a',
axisLabel: {
formatter: '{value} %',
align: 'center',
// ...
},
// scale:true //是否支持缩放
},
tooltip:{
show:true,
trigger:'axis' //触发类型
},
series: [
{
data: this.rate,
type: 'line',
markPoint:{
data:[
{
type:'max'
},
{
type:'min'
}
]
},
markLine:{
data:[
{
type:'average' //平均线
}
]
},
// smooth:true, //是否开启平滑折线
lineStyle:{
color:'red' //线颜色
}
}
]
}
},
components:{
Chart
},
watch:{
rateList(val){
console.log(val);
this.rate= val;
}
}
}
回答:
不知道你具体怎么传的
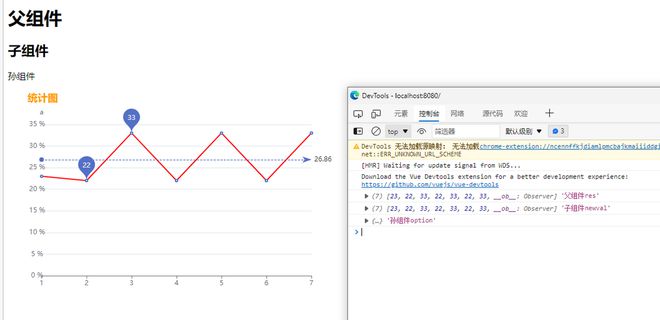
父组件:
<template> <div class="home">
<h1>父组件</h1>
<child :echartsDetail="echartsDetail"></child>
</div>
</template>
<script>
import child from "@/components/child/child";
export default {
name: 'Home',
components: {
child
},
data() {
return {
echartsDetail: []
}
},
created() {
this.getData()
},
methods: {
getData() {
let promise = new Promise(function(resolve, reject){
setTimeout(()=>{
resolve([23,22,33,22,33,22,33]);
}, 2000); // 模拟2秒后promise返回
});
promise.then(res=>{
this.echartsDetail = res
console.log(this.echartsDetail, "父组件res")
});
}
}
}
</script>
子组件:
<template> <div>
<h2>子组件</h2>
<grandson :option="option"></grandson>
</div>
</template>
<script>
import grandson from "@/components/child/grandson/grandson";
import echarts from "@/views/echarts";
export default {
name: "child.vue",
props: {
echartsDetail: {type:Array}
},
data() {
return {
echartsData: [],
option: {}
}
},
components: {
grandson
},
watch: {
echartsDetail: {
handler(newval, oldval) {
console.log(newval, "子组件newval")
this.echartsData = newval
this.option = {
title:{
text:'统计图',
textStyle:{
color:'#ff9900'
},
left: "5%"
},
xAxis: {
type: 'category',
data:[1,2,3,4,5,6,7],
boundaryGap:false
},
yAxis: {
type: 'value',
name:'a',
axisLabel: {
formatter: '{value} %',
align: 'center',
// ...
},
// scale:true //是否支持缩放
},
tooltip:{
show:true,
trigger:'axis' //触发类型
},
series: [
{
data: this.echartsData,
type: 'line',
markPoint:{
data:[
{
type:'max'
},
{
type:'min'
}
]
},
markLine:{
data:[
{
type:'average' //平均线
}
]
},
// smooth:true, //是否开启平滑折线
lineStyle:{
color:'red' //线颜色
}
}
]
}
}
}
},
}
</script>
下级组件:
<template> <div class="grandson">
<p>孙组件</p>
<div id="chart_example" style="width: 600px;height: 400px;"></div>
</div>
</template>
<script>
import * as echarts from 'echarts';
export default {
name: "grandson",
props: {
option: {type:Object}
},
watch: {
option: {
handler(newval, oldval) {
console.log(newval, "孙组件option")
this.myChart.setOption(this.option)
}
}
},
data() {
return {
myChart: ''
}
},
mounted() {
this.createEcharts()
},
methods: {
createEcharts() {
this.myChart = echarts.init(document.getElementById('chart_example'));
},
}
}
</script>
回答:
b组件是写到computed里面传给echarts吗?
echarts有做watch然后setOptions吗?
以上是 Vue中props传值给子组件,子组件接收到props值赋值到data中的,再把data传给echarts,但并没有显示出图形 的全部内容, 来源链接: utcz.com/p/936363.html