vue3+echarts5绘制地图后怎么添加标签?

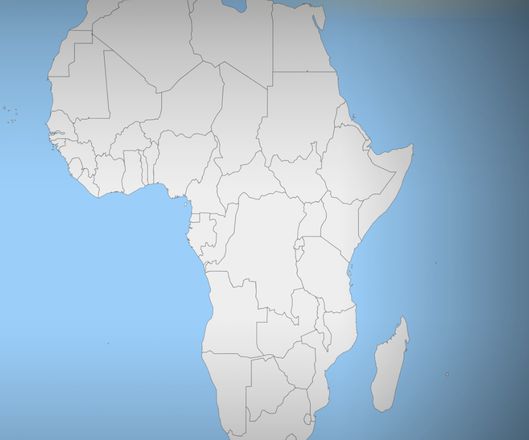
绘制出来大致是这样的,问题是:页面右侧我有一个列表,点击后传入地图几个国家名称,然后在地图上国家附近展示个tips,显示xxx,然后再点击这个xxx的时候调用其他函数
不会搞,帮忙看看
<template> <div id="map" ref="map" style="width: 100%; height: 100%"></div>
</template>
<script setup>
import { ref, onMounted } from "vue";
import * as echarts from "echarts/core";
import {
TitleComponent,
TooltipComponent,
GridComponent,
GeoComponent,
} from "echarts/components";
import { MapChart } from "echarts/charts";
import { CanvasRenderer } from "echarts/renderers";
import world from "@/data/africa.json";
echarts.use([
TitleComponent,
TooltipComponent,
GridComponent,
GeoComponent,
MapChart,
CanvasRenderer,
]);
function getAllNames(data) {
const names = [];
data.features.forEach((feature) => {
if (feature.properties && feature.properties.name) {
names.push({ name: feature.properties.name });
}
});
return names;
}
const map = ref(null);
const mapInstance = ref();
const drawMap = () => {
const option = {
backgroundColor: "#9bcffa",
tooltip: {
trigger: "item",
enterable: true,
formatter: function ({ name, data }) {
console.log(name, data);
return name;
},
},
geo: {
map: "world",
center: [50, 5],
roam: true,
zoom: 1.5,
scaleLimit: {
// min:
},
label: {
normal: {
// show: true,
},
},
tooltip: {
//设置鼠标移至城市板块选中视图配置选项
// backgroundColor: " rgba(3,21,42,0.80)", //设置地图高亮时城市视图背景色框
borderRadius: 0,
trigger: "item",
formatter: (params) => {
return `<div class="map-charts-bar">
<span class="text">${params.name}</span>
</div>`;
},
},
// itemStyle: {
// normal: {
// borderWidth: 2, //设置边线粗细度
// opacity: 0.6, //设置透明度,范围0~1,越小越透明
// areaColor: "#63B8FF", //地图区域颜色
// },
// emphasis: {
// areaColor: "#7FFF00", //高亮时地图区域颜色
// },
// },
nameMap: {
Africa: "非洲",
Algeria: "阿尔及利亚",
},
emphasis: {
itemStyle: {
areaColor: "#2B91B7",
},
show: true,
areaColor: "#3066ba", //鼠标滑过区域颜色
label: {
show: true,
textStyle: {
color: "#fff",
},
},
},
},
series: [
],
};
mapInstance.value.setOption(option);
mapInstance.value.on("click", (param) => {
console.log(param);
});
};
onMounted(() => {
mapInstance.value = echarts.init(map.value);
echarts.registerMap("world", world);
drawMap();
});
</script>
<style scoped>
#map {
width: 100%;
height: 600px;
}
</style>
回答:
<template> <div id="map" ref="map" style="width: 100%; height: 100%"></div>
</template>
<script setup>
import { ref, onMounted } from "vue";
import * as echarts from "echarts/core";
import {
TitleComponent,
TooltipComponent,
GridComponent,
GeoComponent,
} from "echarts/components";
import { MapChart } from "echarts/charts";
import { CanvasRenderer } from "echarts/renderers";
import world from "@/data/africa.json";
import { africaXY } from "@/data/africaXY.js";
echarts.use([
TitleComponent,
TooltipComponent,
GridComponent,
GeoComponent,
MapChart,
CanvasRenderer,
]);
const selectedCountries = ref(["Algeria"]);
function getAllNames(data) {
const names = [];
data.features.forEach((feature) => {
if (feature.properties && feature.properties.name) {
names.push({ name: feature.properties.name });
}
});
return names;
}
const convertData = (data) => {
var res = [];
for (var i = 0; i < data.length; i++) {
var geoCoord = africaXY[data[i].name];
if (geoCoord) {
res.push({
name: data[i].name,
value: geoCoord.concat(data[i].value),
});
}
}
return res;
};
const map = ref(null);
const mapInstance = ref();
const drawMap = () => {
const option = {
backgroundColor: "#132538",
tooltip: {
trigger: "item",
enterable: true,
},
geo: {
map: "world",
center: [50, 5],
roam: true,
zoom: 1.3,
scaleLimit: {
// min:
},
label: {
normal: {
// show: true,
},
},
tooltip: {
trigger: "item",
padding: 0,
enterable: true,
transitionDuration: 1,
textStyle: {
color: "#818A91",
decoration: "none",
},
backgroundColor: "rgba(255,255,255,0.96)",
// borderColor:'#000000',
//borderWidth: 1,
formatter: function (params) {
// var tipHtml = "";
// tipHtml =
// '<div style="box-shadow: 0px 1px 4px 0px rgba(0, 0, 0, 0.3);border-radius:4px;padding:30px 20px;">' +
// '<div style="font-size: 16px;">' +
// params.name +
// "</div>" +
// '<div style="padding:6px 0;"><i style="display: inline-block;margin-bottom: 3px;width:6px;margin-right:6px;height: 6px;background: #3472EE;border-radius: 50%;"></i>2018年整体进口额为10000323万元;</div>' +
// '<div style="padding:6px 0;"><i style="display: inline-block;margin-bottom: 3px;width:6px;margin-right:6px;height: 6px;background: #3472EE;border-radius: 50%;"></i>2018年整体进口所占份额为13%;</div>' +
// '<div style="padding:6px 0;"><i style="display: inline-block;margin-bottom: 3px;width:6px;margin-right:6px;height: 6px;background: #3472EE;border-radius: 50%;"></i>2018年年进口额增长率为-10%;</div>' +
// "</div>";
return params.name;
},
},
// itemStyle: {
// normal: {
// borderWidth: 2, //设置边线粗细度
// opacity: 0.6, //设置透明度,范围0~1,越小越透明
// areaColor: "#63B8FF", //地图区域颜色
// },
// emphasis: {
// areaColor: "#7FFF00", //高亮时地图区域颜色
// },
// },
nameMap: {
Africa: "非洲",
Algeria: "阿尔及利亚",
},
emphasis: {
itemStyle: {
areaColor: "#2B91B7",
},
show: true,
areaColor: "#131834", //鼠标滑过区域颜色
label: {
show: true,
textStyle: {
color: "#fff",
},
},
},
},
series: [
{
type: "scatter",
coordinateSystem: "geo",
data: convertData([{ name: "Algeria"}]),
zlevel: 12,
// symbolSize: [20, 37], // 标记的大小,[宽、高]
//symbol: 'pin', //气泡
// symbol:
// "image://data:image/png;base64,iVBORw0KGgoAAAANSUhEUgAAABQAAAAlCAYAAABCr8kFAAAABGdBTUEAALGPC/xhBQAAACBjSFJNAAB6JgAAgIQAAPoAAACA6AAAdTAAAOpgAAA6mAAAF3CculE8AAAABmJLR0QAAAAAAAD5Q7t/AAAACXBIWXMAAAsSAAALEgHS3X78AAAC1klEQVRIx+2WS0gVURjHf6OXvD4jM1+ZVhJmWNfwolmhqxaWRFQgLcwIWkVFG90EEUGhmyBKcpdUCGaPhenClZDgq8iyMqy8lo+0C5nPaz6+FndGx7mP5rqIFv3hwJnvO+d3zjffOd+MggnF1l8WM+MAgswONCtLIINHC68of32H/4H/INCrRCRYRE6LyCMR6RmeGZePk04Rkaeq3fxGRMQmIr3iXx9EZLcZWKEEpkJ/sJQAYZqS9BxFB+wEsrRn1+Ist4fv8tjZyNCvERLXxHE0poCzCaewBoXoGa2KouSuAIrIPuC5ZpxZdHHi3UU6J7o9IrFHZlCz4wahQVa9OUdRlHZYPjbFeu+trw/pGHMgCxEerWPMQeVAnXGdEq2jAXfqvU9G2rzCtFY33GoE7tI6WvmK13sHpuaQxSifCRycnjOaEozAFXUu0bIJx7TTJzA+dL3RFGwMeVDvPRK3x2/IxxP2GoHfjcBOvfdCaj72tWleYfa1aZzbmmcEtmsd7dhkA236Ea6FeW72dnLP0T3lnJ22xoSEuYo3Z4Sf32bHGuzx5chUFKVrhUVEXqzypjR4fdEikrlKYLTP7IlIbYCwS/iTiISIyLhJWB9mJCKHTQJtpoAqtO4PsHLTMBVoERGnD9hnf3NXXLmSsooQIBaILjqYn1OQl11lnFDb2Hyyobn9NfADGKkuL531AJaUVUQA23EXiaVFys4UHUtPTV4qTZ++DNVerXxwXx8M8A3oqS4vnQQILimriAVygSjcVzEJdznKann5Nio9NSU6KiLM2ts/OHrtTs0gsAWIARaBSSACSM7cf+BnV0vTlAWwsVwtDgEp+hCuV9W80j2Gqy1RndcP1KvzbUBTkLrSauXxI2oB3gB2dZVnwEY1rA3qa7CqvgXABYzjLld9LJe9BaDLmJR0IM6YeRM7HAHea0nxdmzigHVAJBCqRmEB5tWdTAMTvo7Nbwng09R+hsh2AAAAAElFTkSuQmCC",
symbolOffset: [0, "-50%"], // 标记相对于原本位置的偏移
// label: {
// normal: {
// show: true,
// offset: [18, -10], // 是否对文字进行偏移。默认不偏移。例如:[30, 40] 表示文字在横向上偏移 30,纵向上偏移 40。
// formatter: function (params) {
// console.log("气泡:", params);
// return "{fline|" + params.data.name + "}";
// },
// position: "insideTopLeft", // 标签相对于图形包围盒左上角的位置。
// distance: 0,
// backgroundColor: "#16B47F",
// padding: [0, 0],
// borderRadius: 3,
// // verticalAlign:'middle',
// // lineHeight: 32,
// color: "#ffffff",
// rich: {
// fline: {
// padding: [4, 6, 4, 6],
// color: "#ffffff",
// },
// },
// },
// emphasis: {
// show: false,
// },
// },
itemStyle: {
emphasis: {
borderColor: "#fff",
borderWidth: 1,
},
},
},
],
};
mapInstance.value.setOption(option);
mapInstance.value.on("click", function (params) {
console.log("---params----", params);
});
};
onMounted(() => {
mapInstance.value = echarts.init(map.value);
echarts.registerMap("world", world);
drawMap();
});
</script>
<style scoped>
#map {
width: 100%;
height: 600px;
}
</style>
以上是 vue3+echarts5绘制地图后怎么添加标签? 的全部内容, 来源链接: utcz.com/p/934875.html


