echarts 点击事件范围问题?

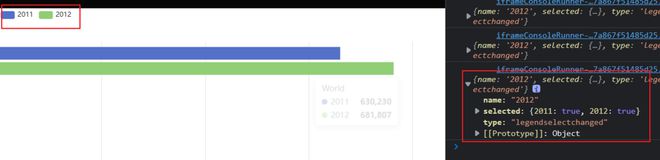
1.可以扩大点击范围吗?现在只能点击绿色的进度条。
2.红色的部分也是echarts 出来的canvas
initChart(val) { if (this.myChart) {
this.myChart.dispose();
}
this.myChart = echarts.init($(".chart6")[0]);
this.myChart.on("click", (res) => {
this.$emit('drillingIn', res)
})
// 传入数据生成 option
this.option = option;
this.myChart.setOption(this.option);
},
let option = { backgroundColor: "",
grid: {
left: "10%",
right: "0%",
bottom: "-10%",
top: "7%",
height: "99%",
containLabel: true,
},
xAxis: {
show: false,
inverse: true,
type: "value",
},
yAxis: [
{
type: "category",
inverse: true,
// axisLabel: {
// show: true,
// textStyle: {
// color: '#fff',
// fontSize: '16'
// }
// },
axisLabel: {
show: true,
// 强制显示所有标签
interval: 0,
textStyle: {
color: "#0FC2EF",
fontSize: 14,
},
formatter: function (value) {
var res = value;
// 长度超过n个的以省略号显示
if (res.length > 8) {
res = res.substring(0, 8) + "...";
}
return res;
},
},
splitLine: {
show: false,
},
axisTick: {
show: false,
},
axisLine: {
show: false,
},
data: datas.Ydata,
},
{
type: "category",
inverse: true,
axisTick: "none",
axisLine: "none",
show: false,
axisLabel: {
textStyle: {
color: "#ffffff",
fontSize: "10",
},
},
data: datas.Ydata,
},
{
show: true,
inverse: true,
data: datas.Xdata,
axisLabel: {
textStyle: {
fontSize: 14,
color: "#fff",
},
},
axisLine: {
show: false,
},
splitLine: {
show: false,
},
axisTick: {
show: false,
},
},
],
series: [
{
name: "值",
type: "bar",
zlevel: 1,
itemStyle: {
// barBorderRadius: [0, 20, 20, 0], // 圆角(左上、右上、右下、左下)
color: "#00FBFE", //
position: "right"
},
label: {
normal: {
color: "#fff",
show: true,
formatter: "|",
fontWeight: 'bolder',//加粗
position: "left",
fontSize: "12",
distance: -3,//转移
},
},
// barCateGoryGap:1,
barWidth: 5,
data: datas.Ydata,
},
{
name: "外框",
type: "bar",
itemStyle: {
normal: {
barBorderRadius: 0,
color: "#003256", //rgba设置透明度0.14
},
},
barGap: "-100%",
z: 0,
barWidth: 5,
data: new Array(11).fill(this.maxNum),
},
],
};
回答:
使用legendselectchanged方法:
myChart.on('legendselectchanged', function(params) { console.log(params)
});
回答:
使用getZr()监听整个画布的点击事件,任意位置触发点击事件:
this.myChart.getZr().on('click' , params => {})
回答:
triggerEvent
clickable
this.myChart.on('click','yAxis.category', function (res) {}) yAxis: [
{
triggerEvent: true,
type: "category",
inverse: true,
// axisLabel: {
// show: true,
// textStyle: {
// color: '#fff',
// fontSize: '16'
// }
// },
axisLabel: {
clickable:true,
以上是 echarts 点击事件范围问题? 的全部内容, 来源链接: utcz.com/p/934382.html