echarts 使用 markPoint 没有显示标记?
案例1、图一是本地项目没有显示标记, 图二是官方测试有标记,代码是同一个
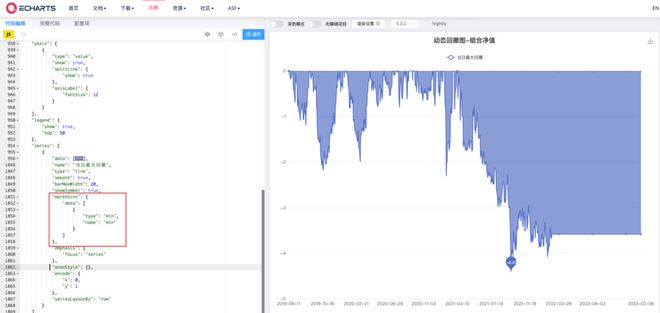
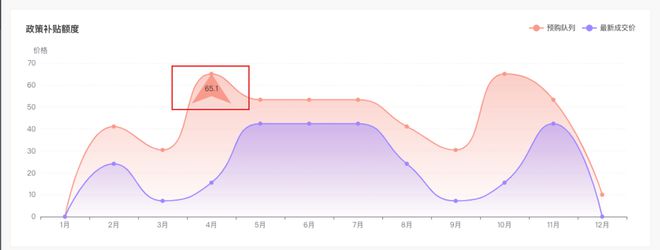
案例2、vue-next-admin 项目的标记是可以显示的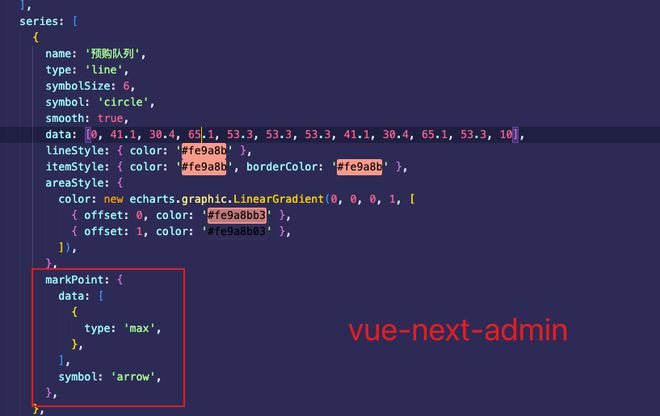
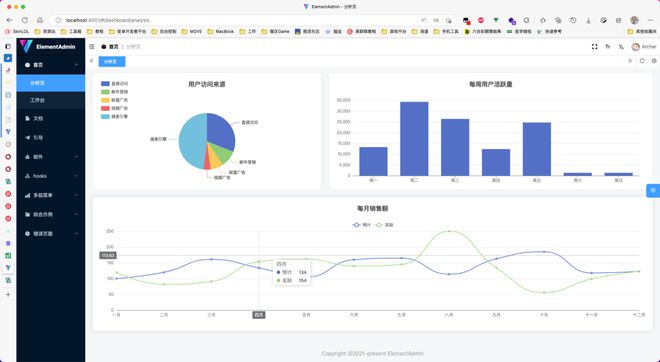
案例3、从vue-element-plus-admin拉下的的代码,设置markPoint也不行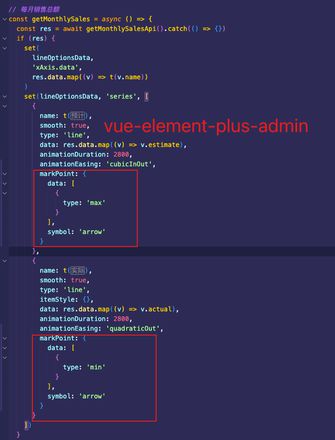
option = { "title": {
"text": "动态回撤图-组合净值",
"left": "center"
},
"toolbox": {
"feature": {
"saveAsImage": {}
}
},
"dataZoom": {
"type": "inside",
"show": true,
"start": 0,
"end": 100
},
"xAxis": {
"type": "category",
"show": true,
"minInterval": 0,
"splitLine": {
"show": false
},
"data": [
"2019-06-11",
"2019-06-12",
"2019-06-13",
"2019-06-14",
],
"axisLabel": {
"showMinLabel": true,
"showMaxLabel": true
}
},
"grid": {
"left": 20,
"right": 40,
"bottom": 20,
"top": 100,
"containLabel": true
},
"tooltip": {
"trigger": "axis",
"confine": true,
"appendToBody": true,
"axisPointer": {
"type": "cross"
},
"padding": [
5,
10
]
},
"yAxis": [
{
"type": "value",
"show": true,
"splitLine": {
"show": true
},
"axisLabel": {
"fontSize": 12
}
}
],
"legend": {
"show": true,
"top": 50
},
"series": [
{
"data": [
0,
0,
-0.02,
-0.1,
],
"name": "当日最大回撤",
"type": "line",
"smooth": true,
"barMaxWidth": 20,
"showSymbol": true,
"markPoint": {
"data": [
{
"type": "min",
"name": "min"
}
]
},
"emphasis": {
"focus": "series"
},
"areaStyle": {},
"encode": {
"x": 0,
"y": 1
},
"seriesLayoutBy": "row"
}
],
"dataset": [],
"darkMode": "auto"
}
回答:
检查一下每个项目的 ECharts 的版本是否一致。
回答:
eChart某些属性必须显式设置为"显示",例如y轴,就必须设置
...axisLine: {
show: true
}
...
才会显示出来。
检查一下类似的属性。
以上是 echarts 使用 markPoint 没有显示标记? 的全部内容, 来源链接: utcz.com/p/933599.html


